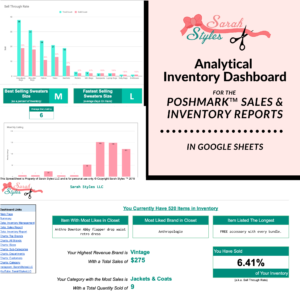
This Revenue and Trends Dashboard is an essential tool for the Reseller on ALL PLATFORMS! The dashboard will give you insight into your data and help you make informed decisions. The simulator will help you identify, based on historical trends, how to meet your monthly monetary goals! It will help identify strategies that are working for you and the ones that can be improved for increased profits. Look at your sell through rates, average sales prices, compare platforms, sourcing locations, and more!
It’s in an easy to use format on Google Sheets; no need to purchase additional spreadsheet software such as Microsoft Excel.
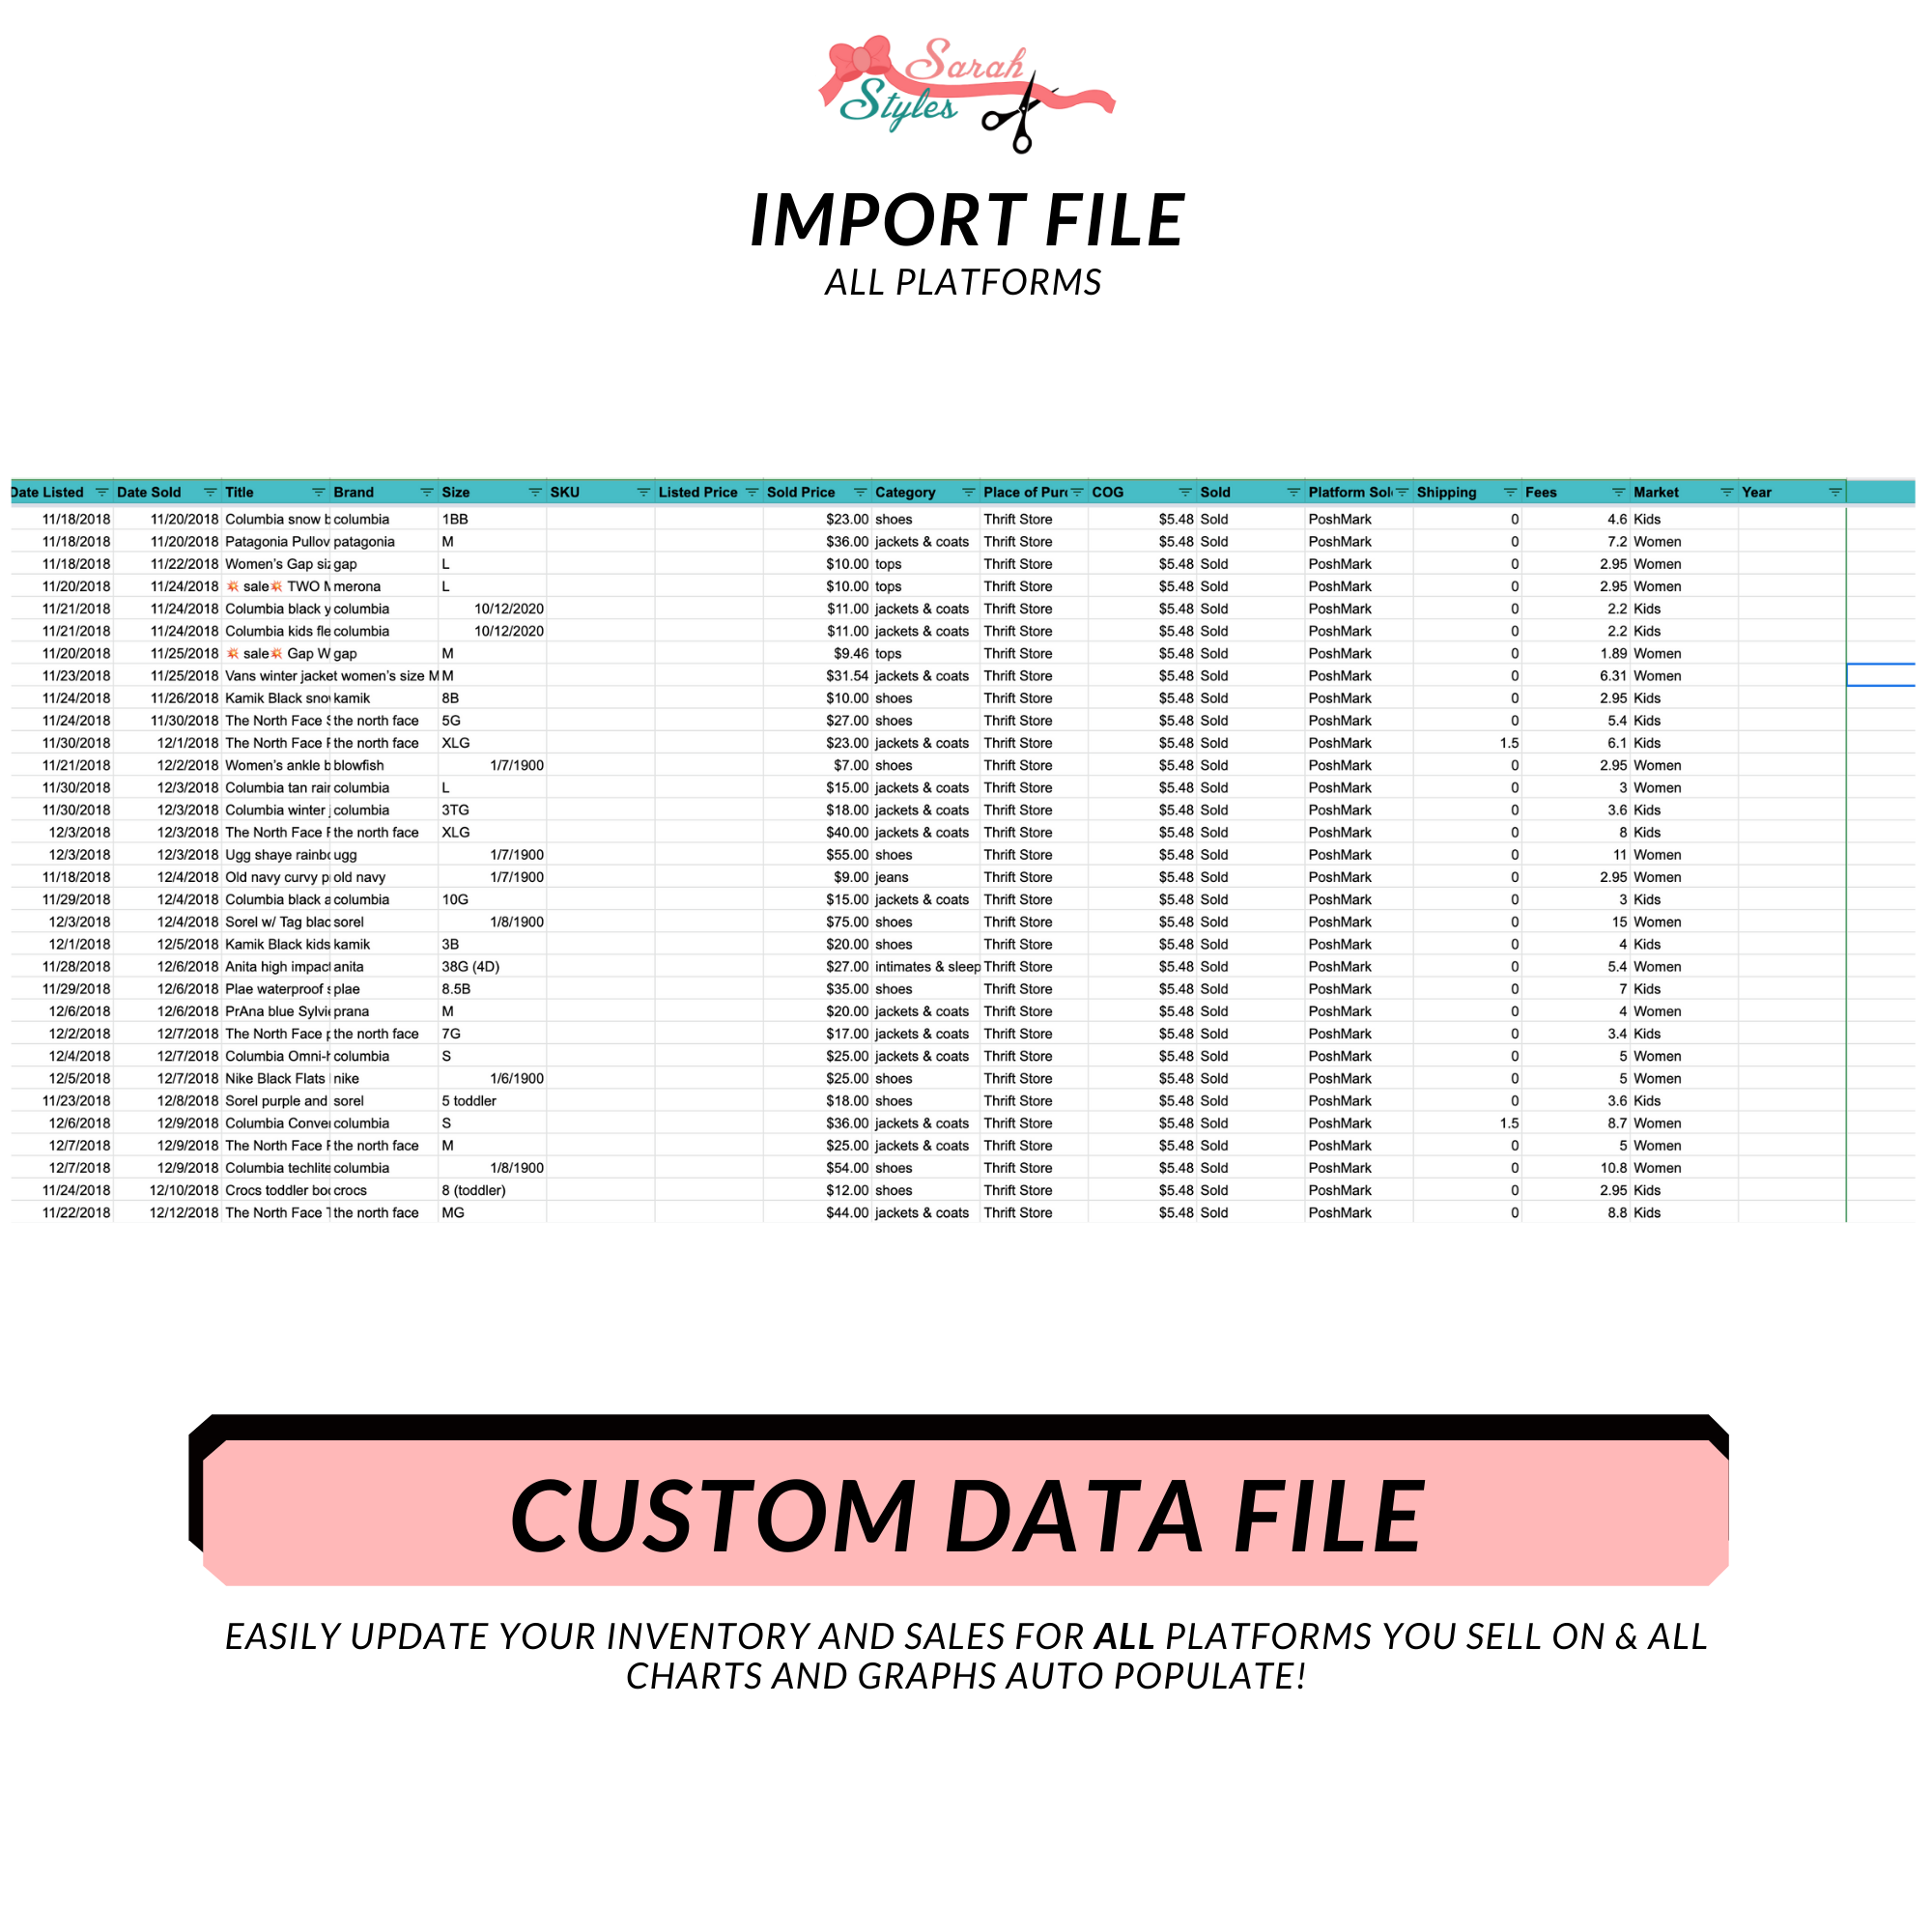
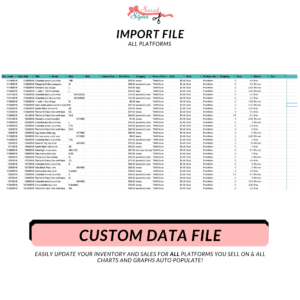
This product comes with two downloadable Google Sheet files. One is used to track your data, and one is the analytics dashboard. The data import file is compiled of your data from the platforms you sell on. Your inventory and sales data is your responsibility to compile into the format provided. The product comes with a step by step video tutorial to help. I recommend basic spreadsheet knowledge to use this product. Such as data entry, copy and paste. A simple copy and paste from the data import file into the Analytical Dashboard and all the graphs and charts will populate.
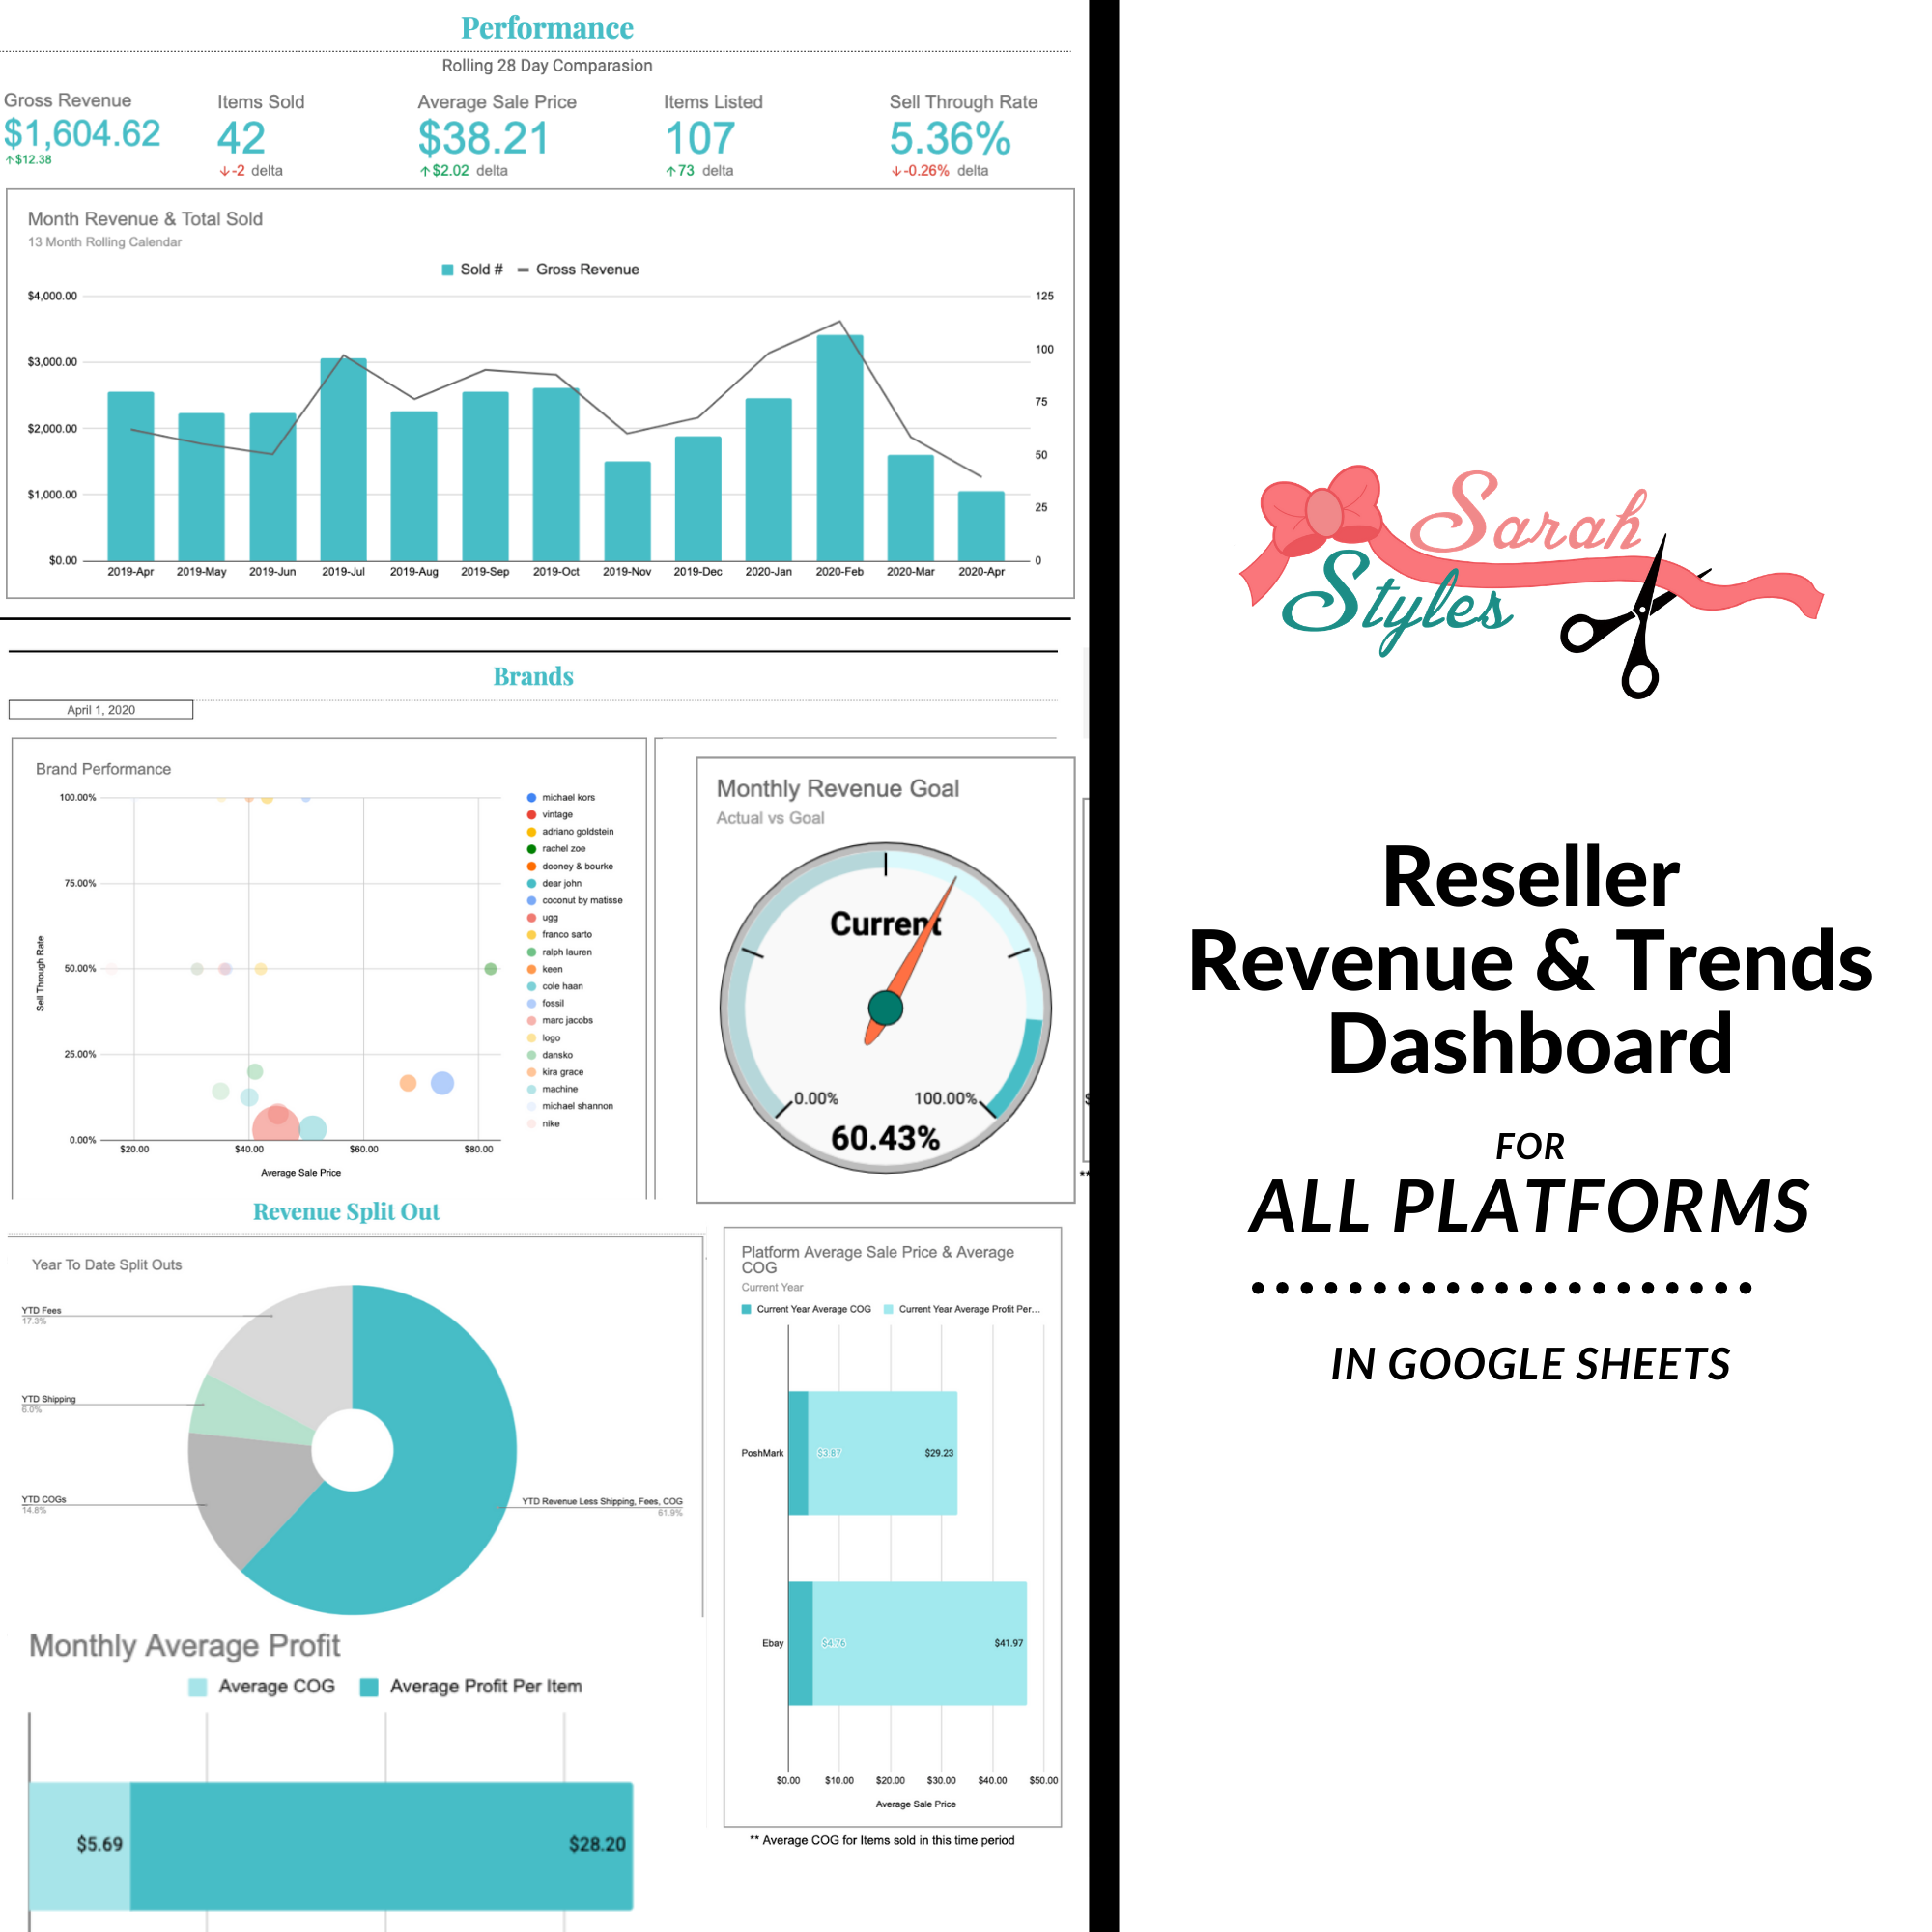
This Dashboard includes, in the form of graphs, charts, and tables:
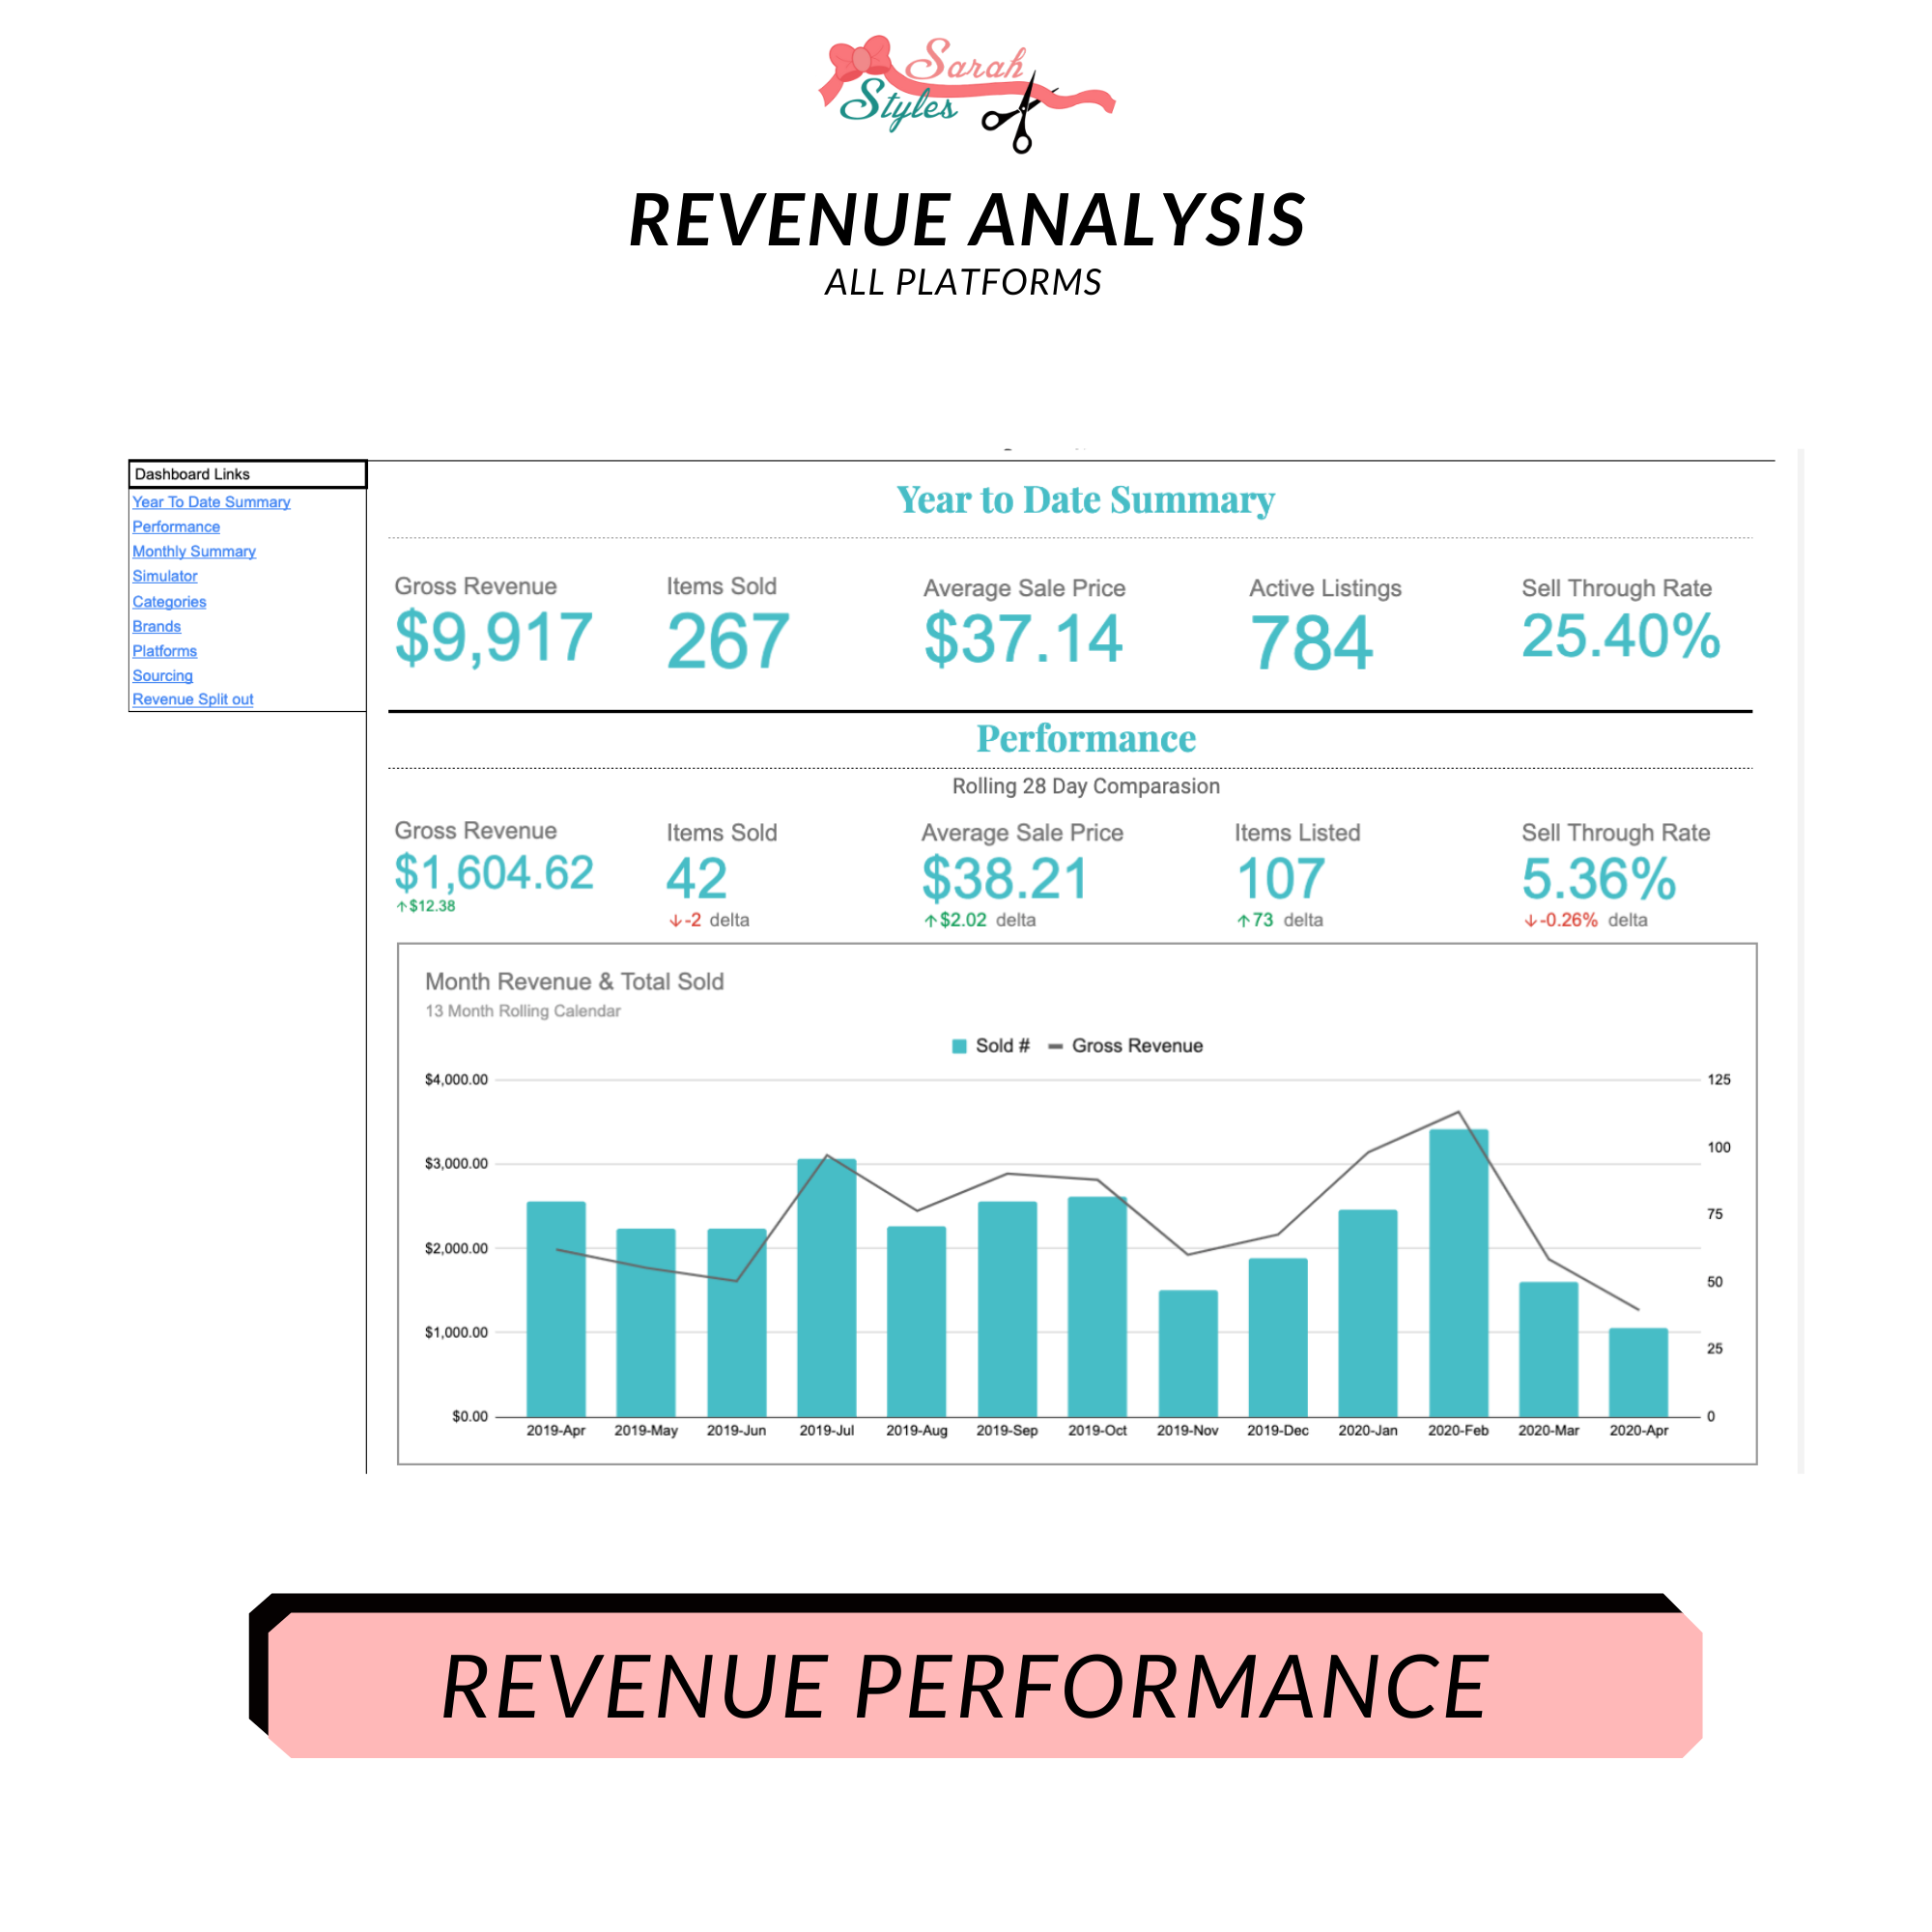
Year to Date & Year Over Year
– Gross Revenue
– Items Sold
– Average Sale Price (ASP)
– Active Listings
– Sell Through Rate
– Average Cost of Goods (COGS)
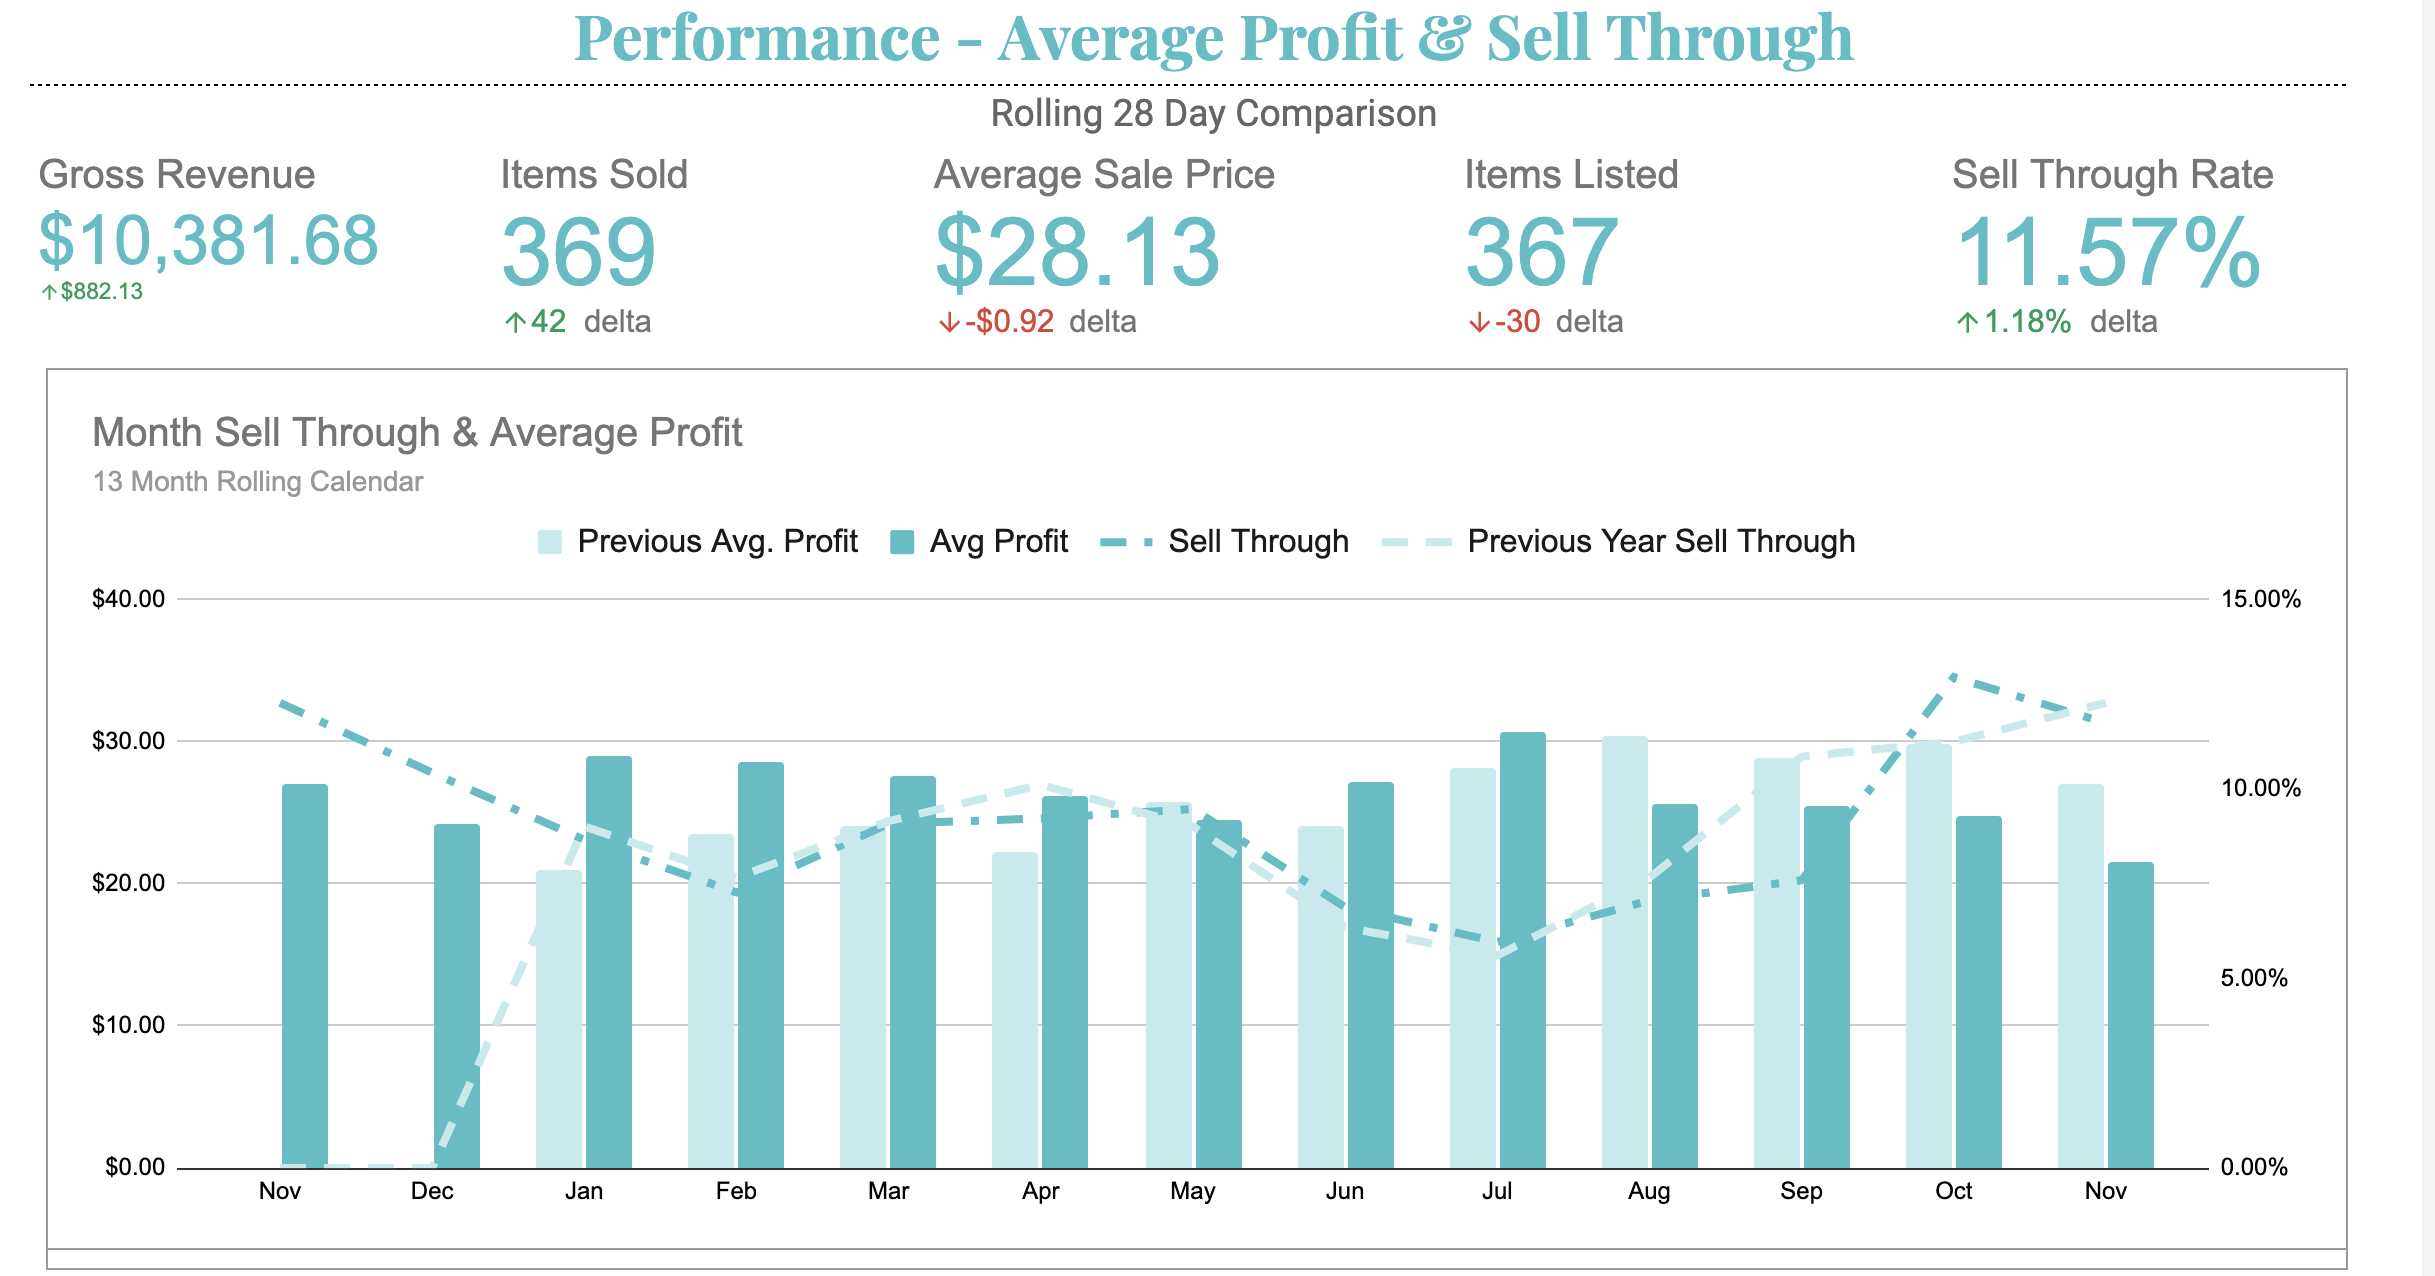
Performance – rolling 28 days comparison
– Gross Revenue
– Items Sold
– Average Sale Price
– Sell Through Rate
Revenue & Items Sold Chart – Rolling 13 months
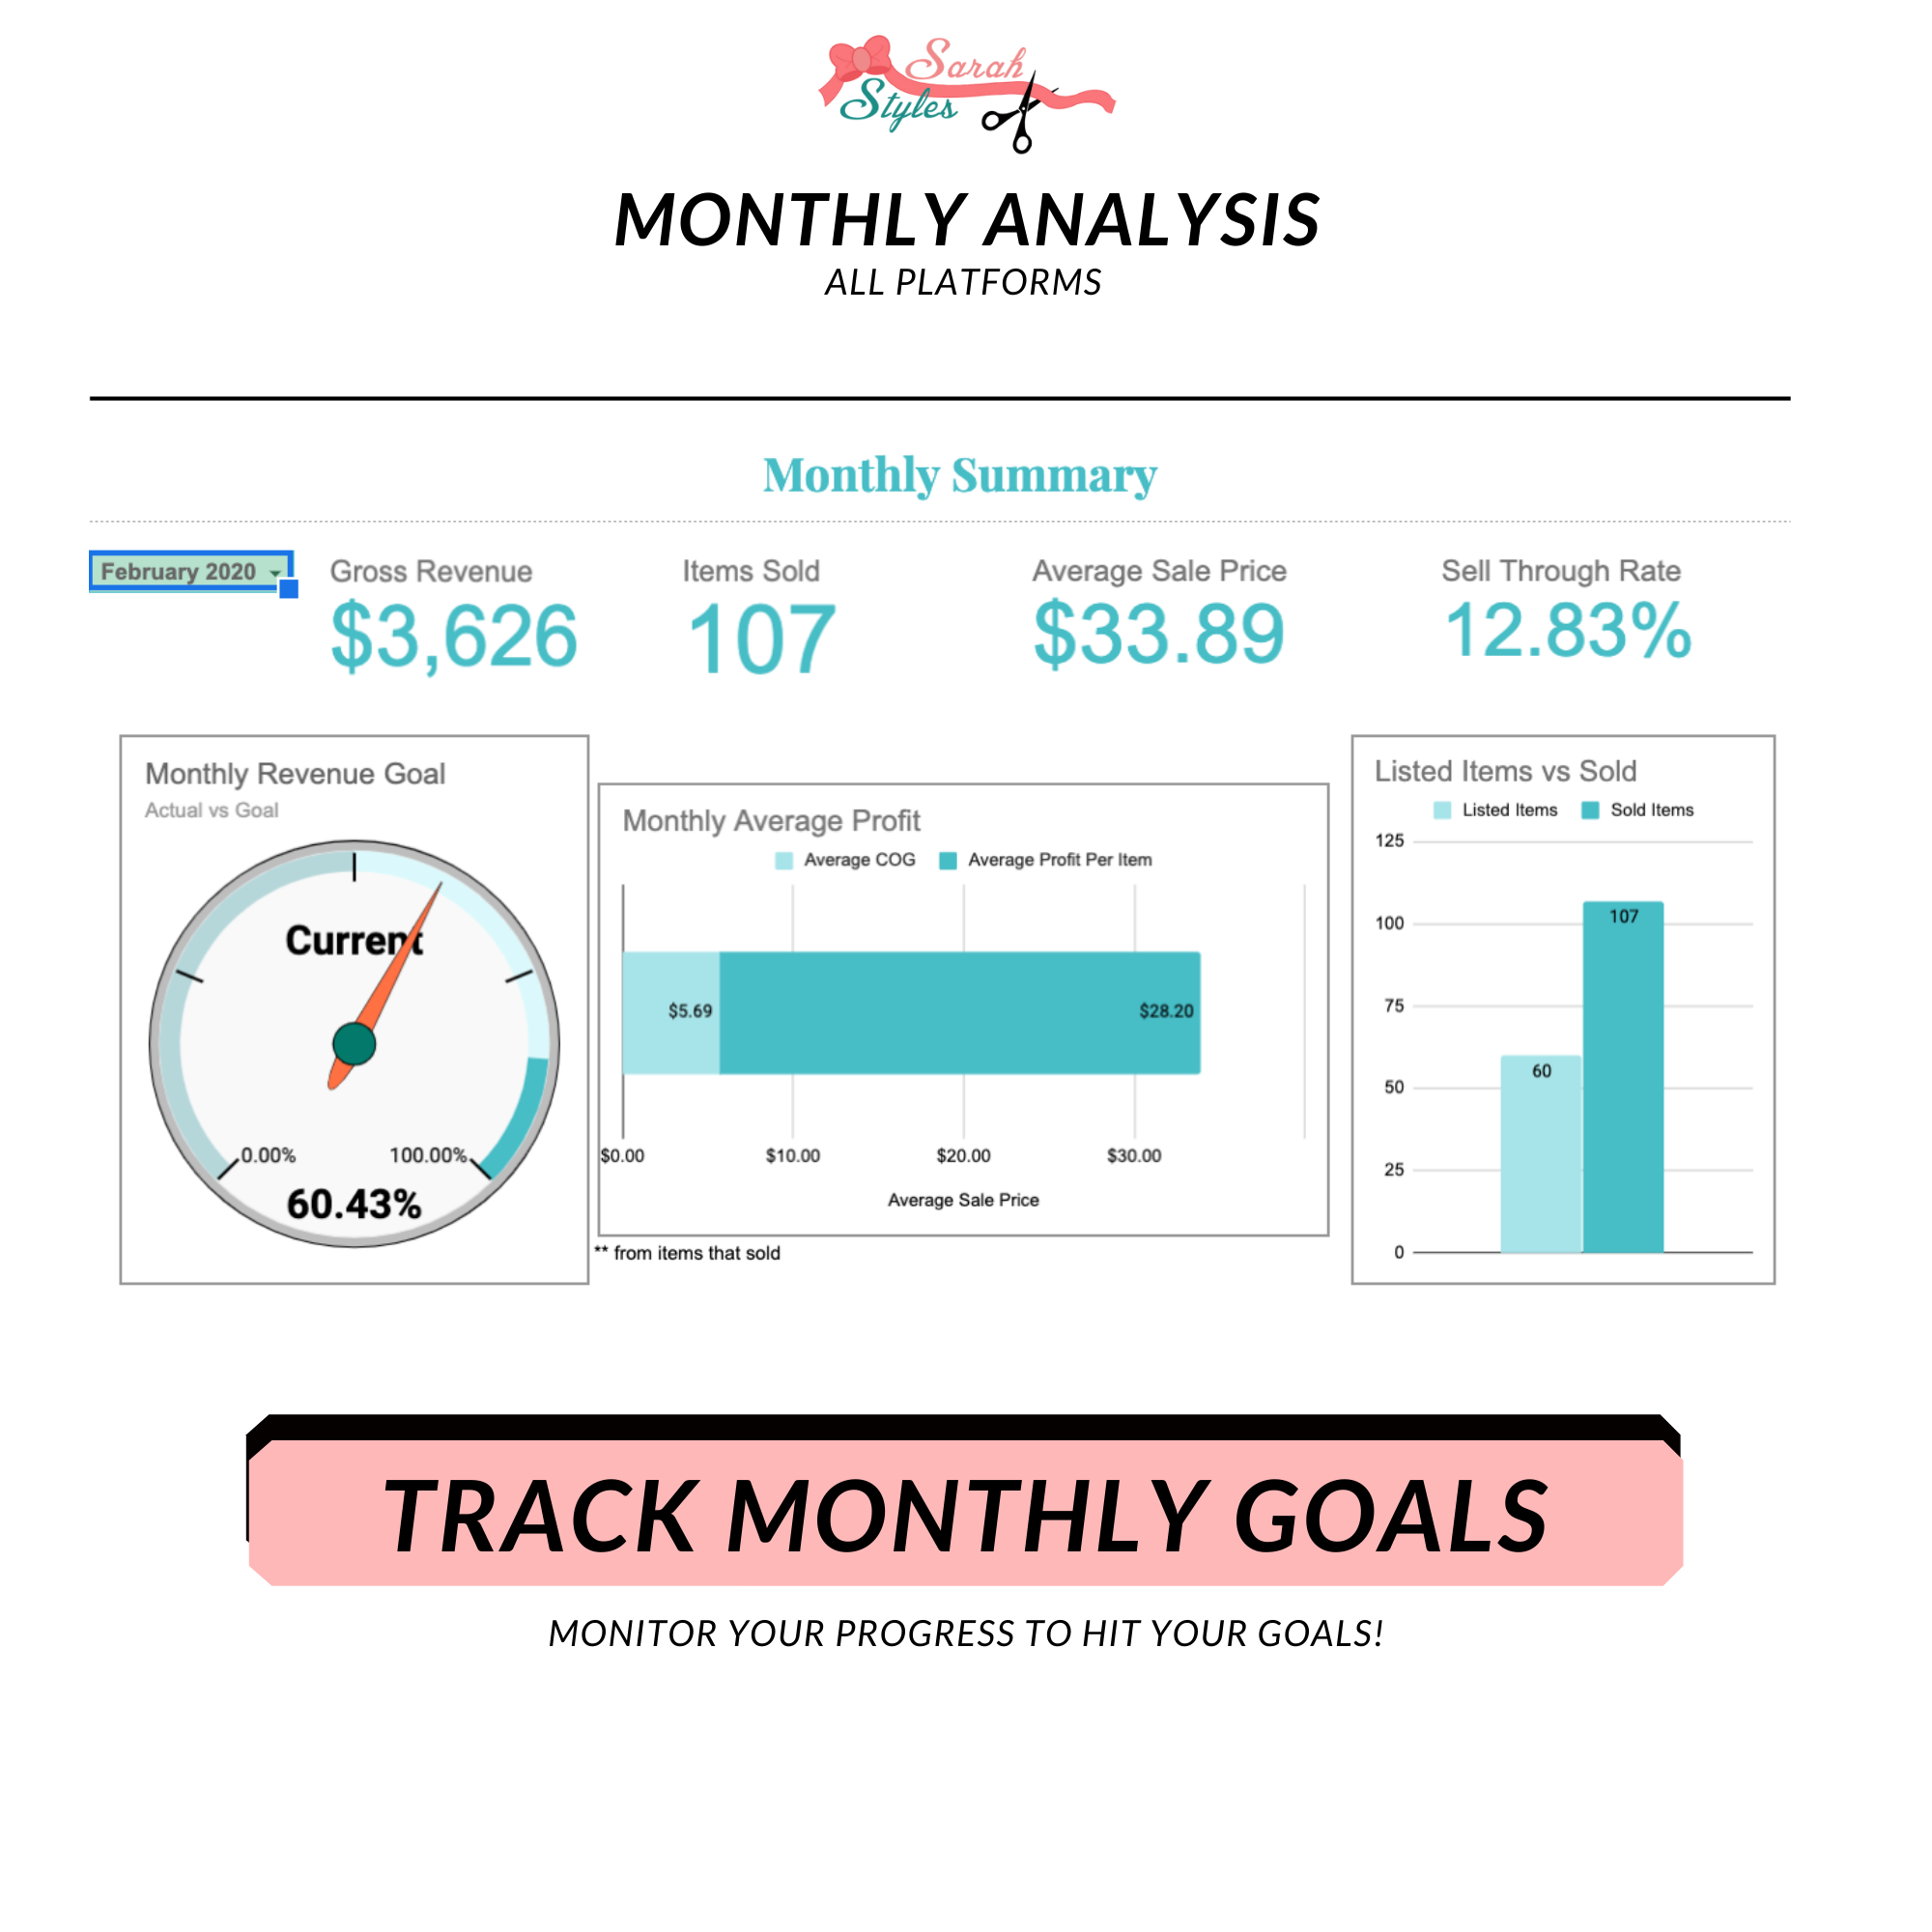
Monthly Analysis – Drop Down Menu to Select Months
– Gross Revenue
– Items Sold
– Average Sale Price
– Sell Through Rate
– Gauge Chart – Percent of Actual to Goal
– Split out of Cost of Goods and Sale Price
– Items Listed vs Items Sold
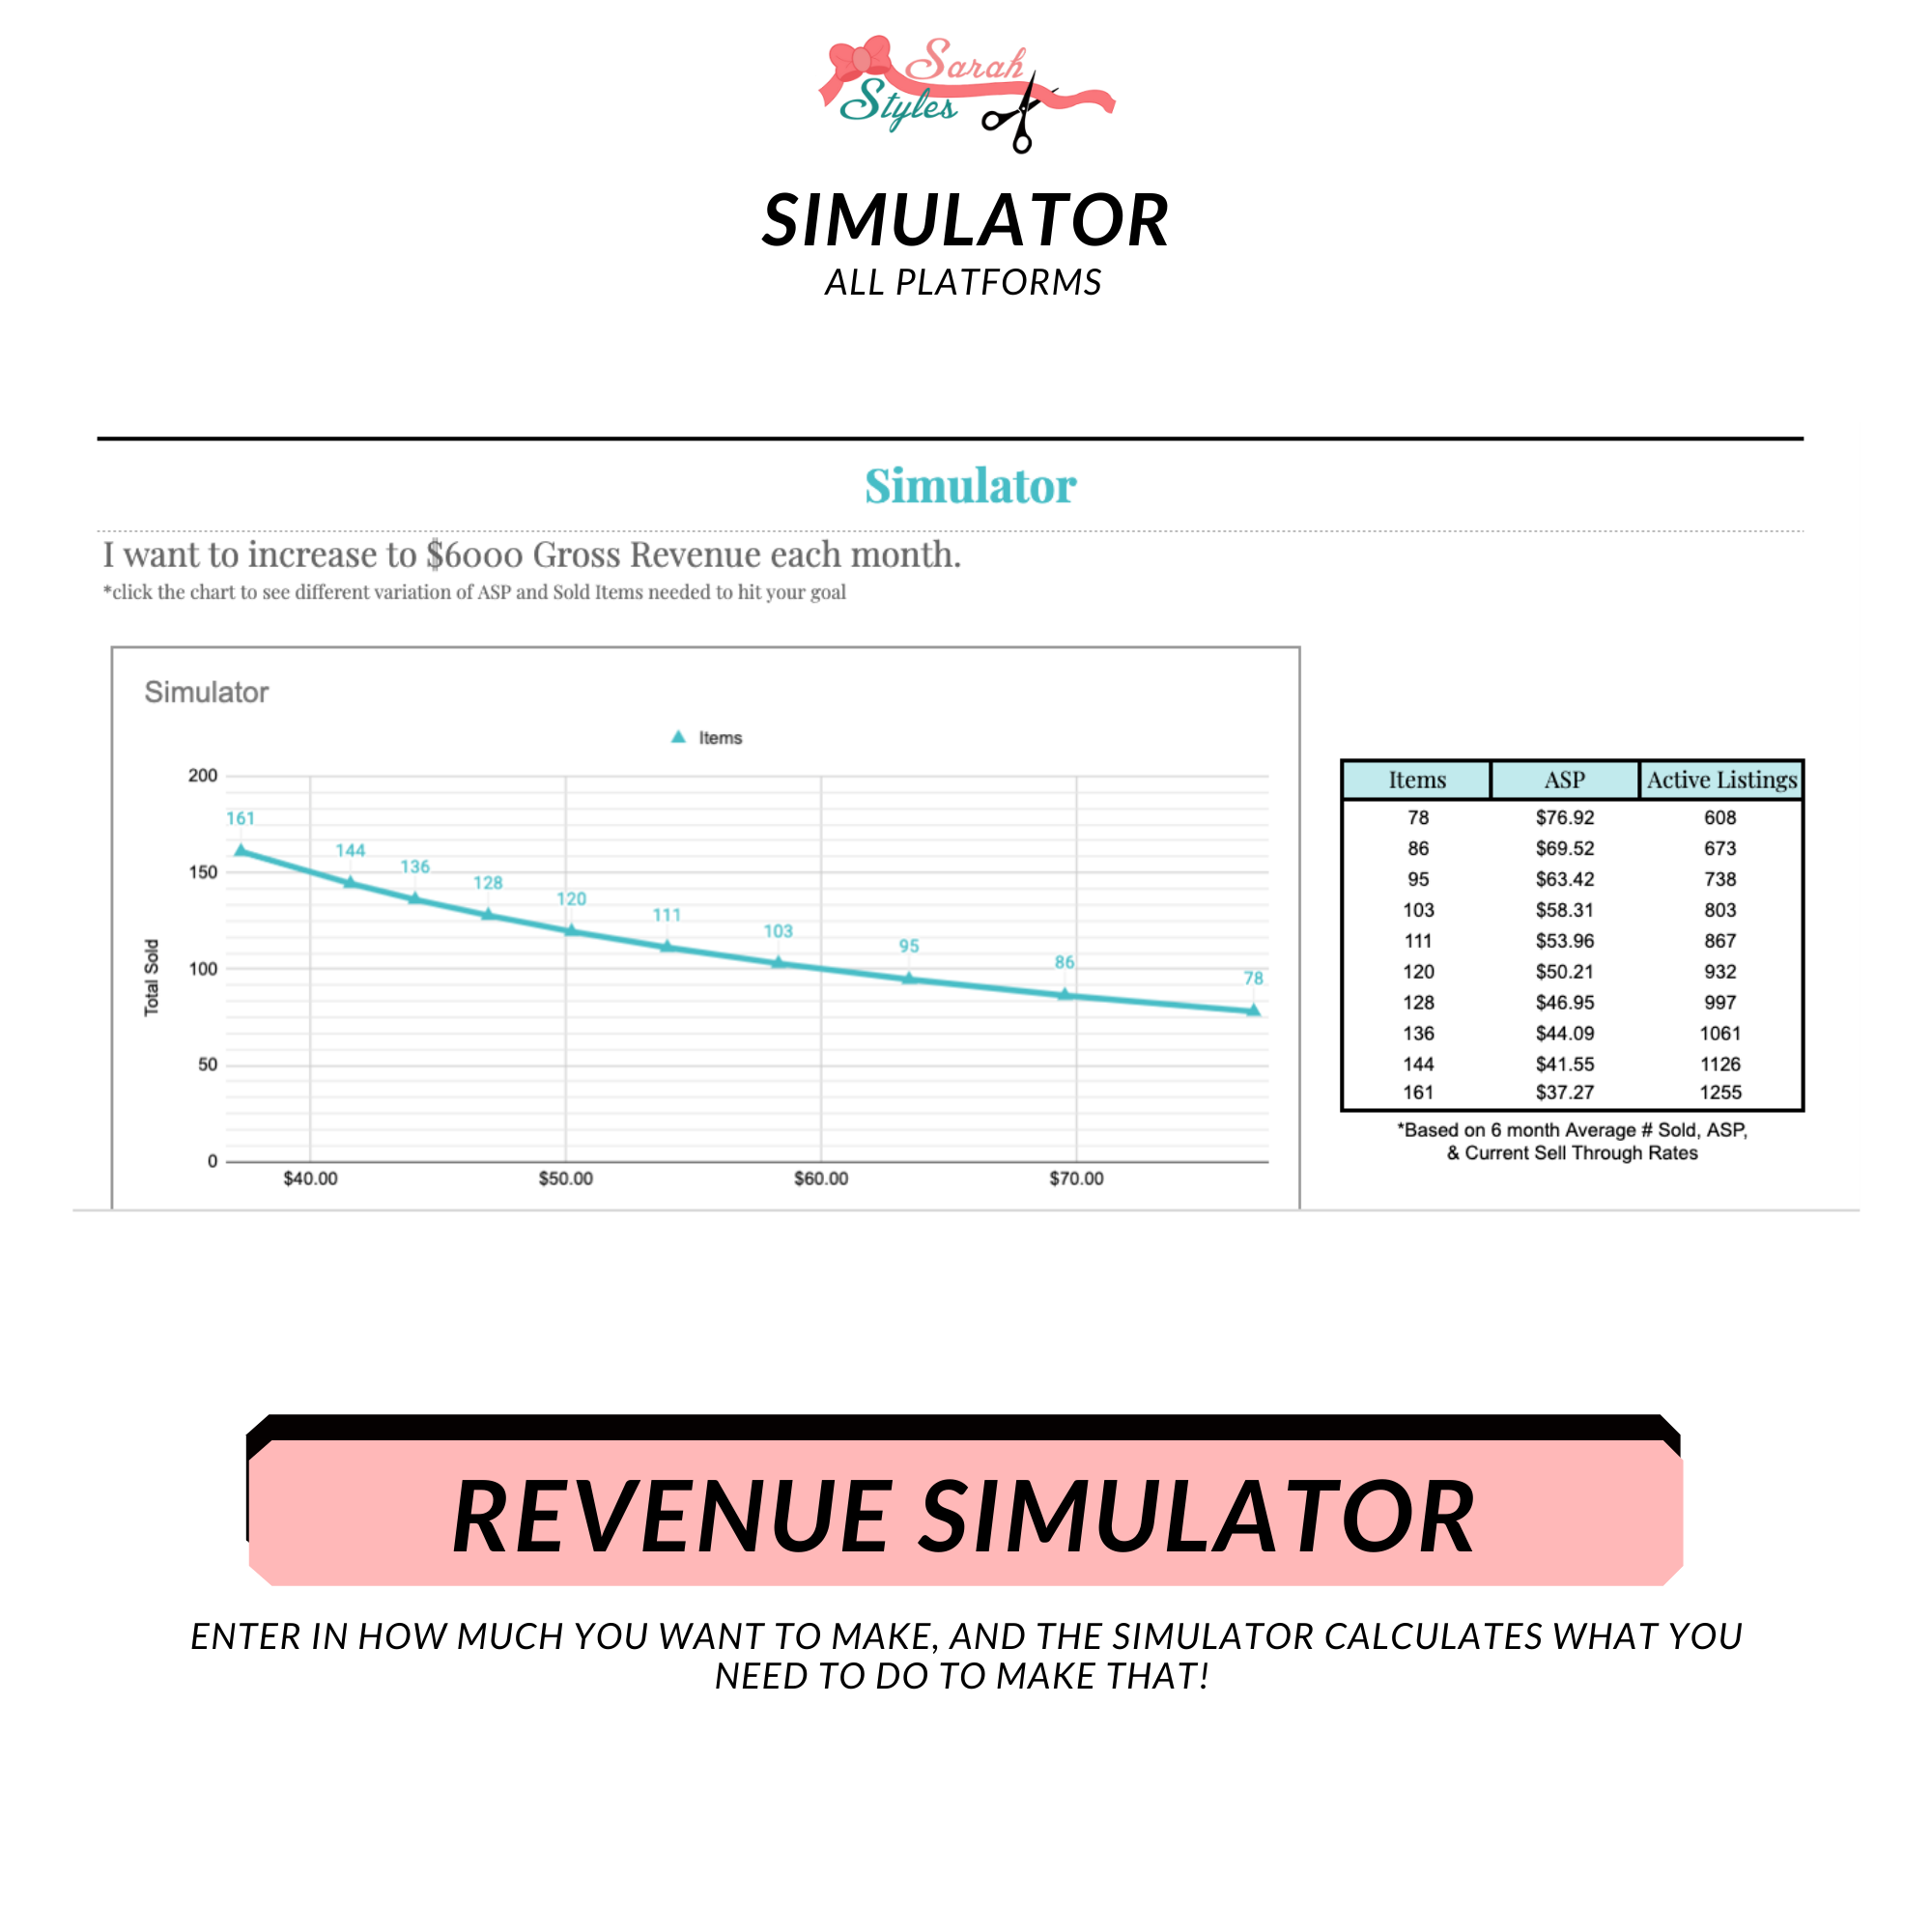
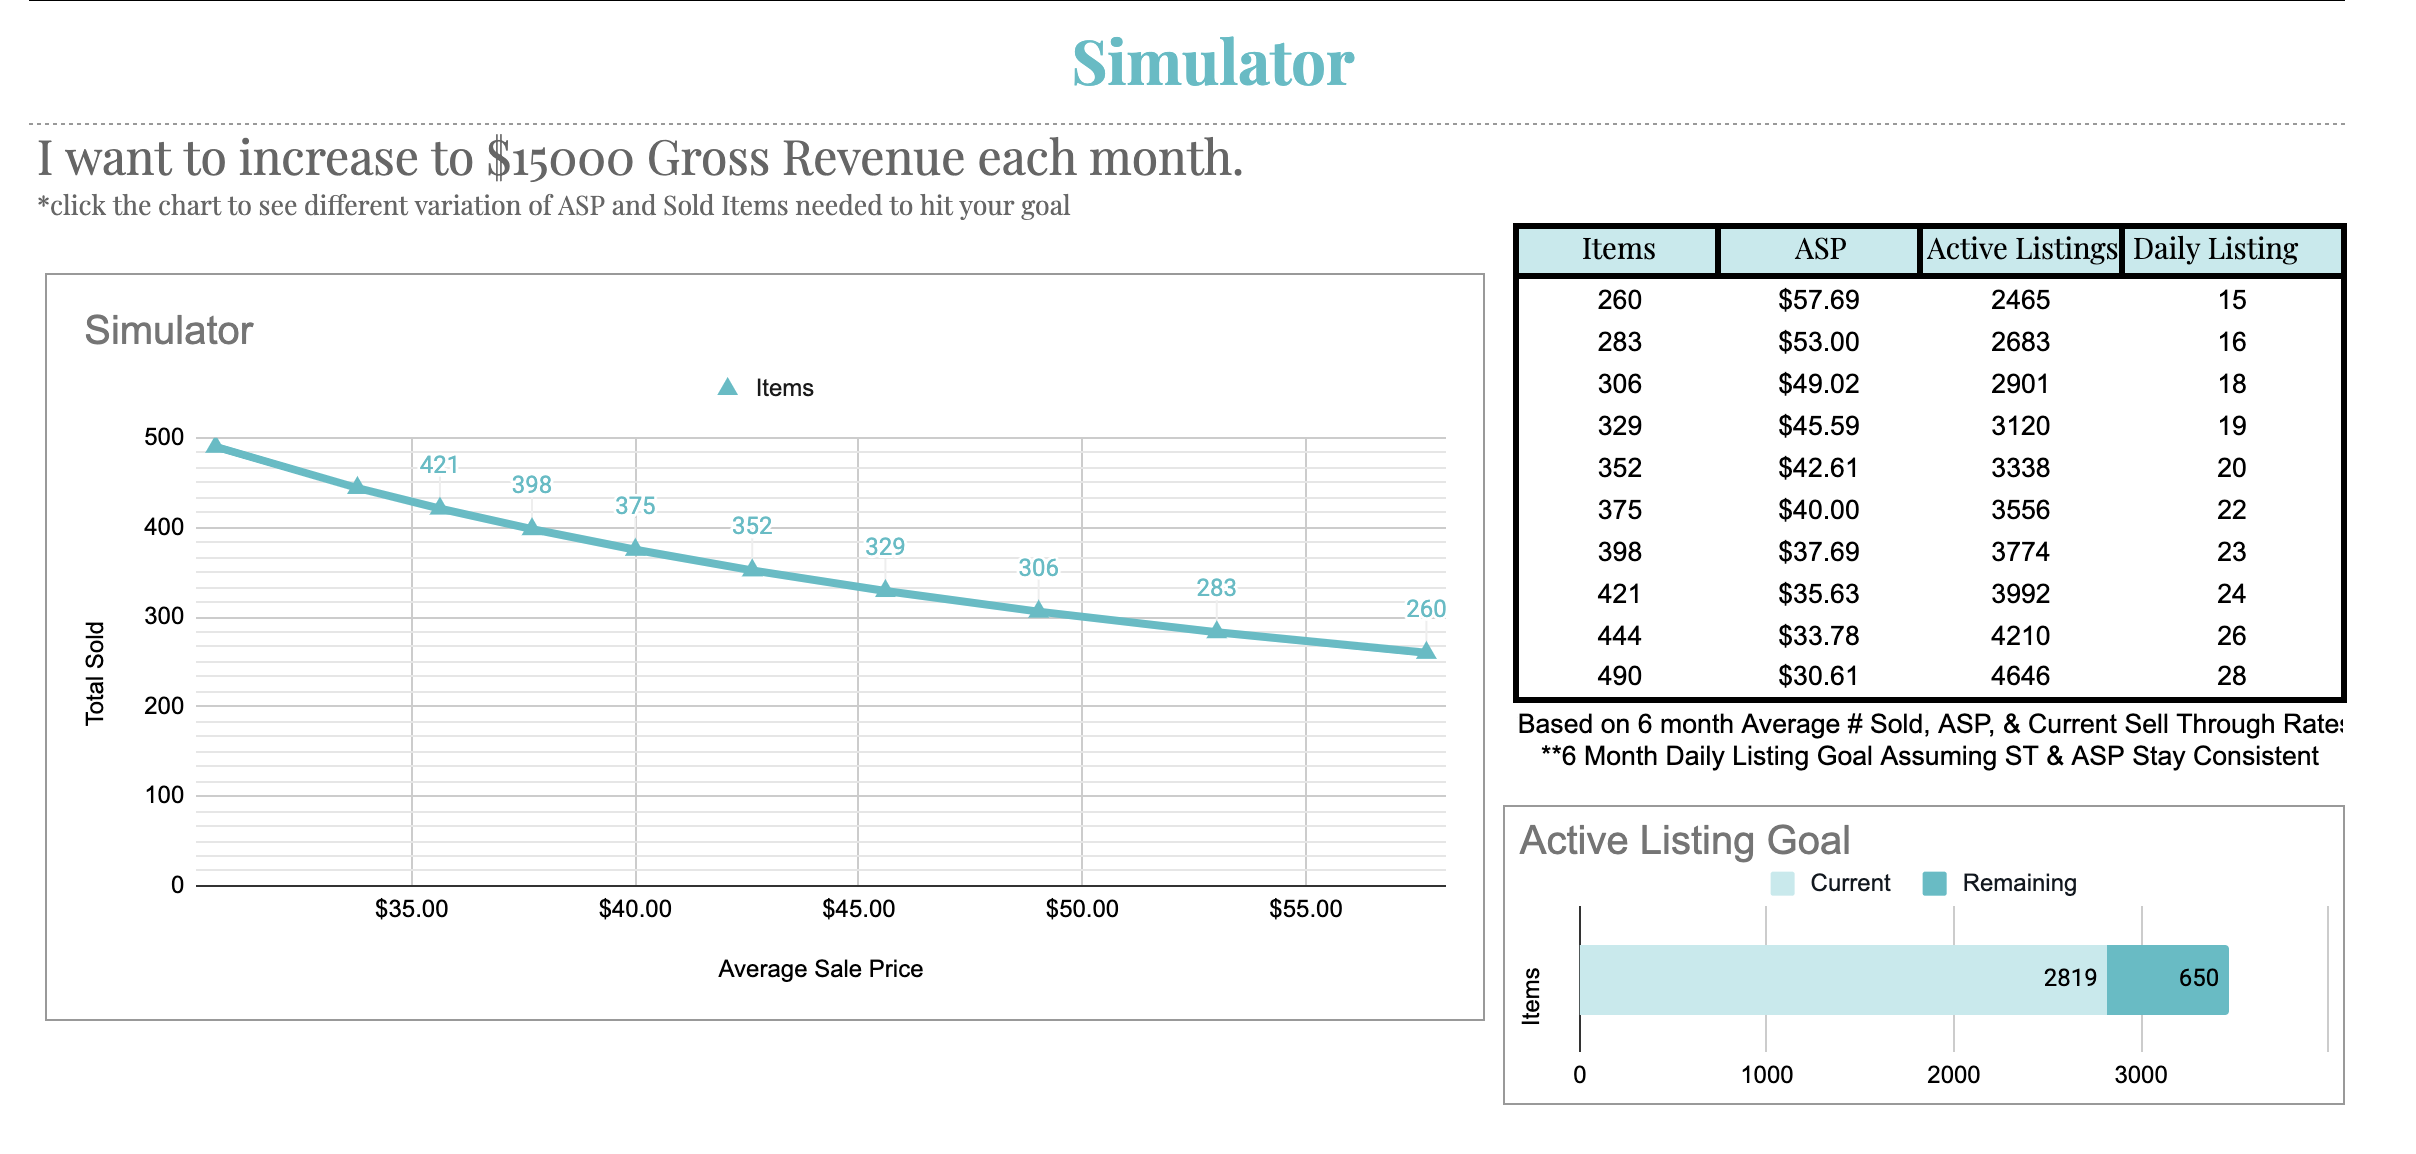
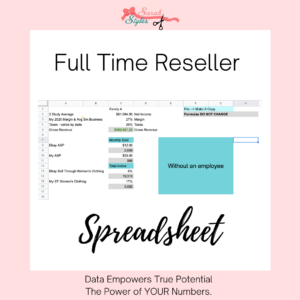
Simulator – Average Sale Price, Items Sold, Active Items, Daily Listings Needed to Hit your Monetary Goal. And Listings To Goal Tracker.
Categories – Top 20 Gross Revenue
– Sell Through Rate (Gross & Profit)
– Average Sale Price
- Broken Out By Cogs & Profit
– Average Days on Hand
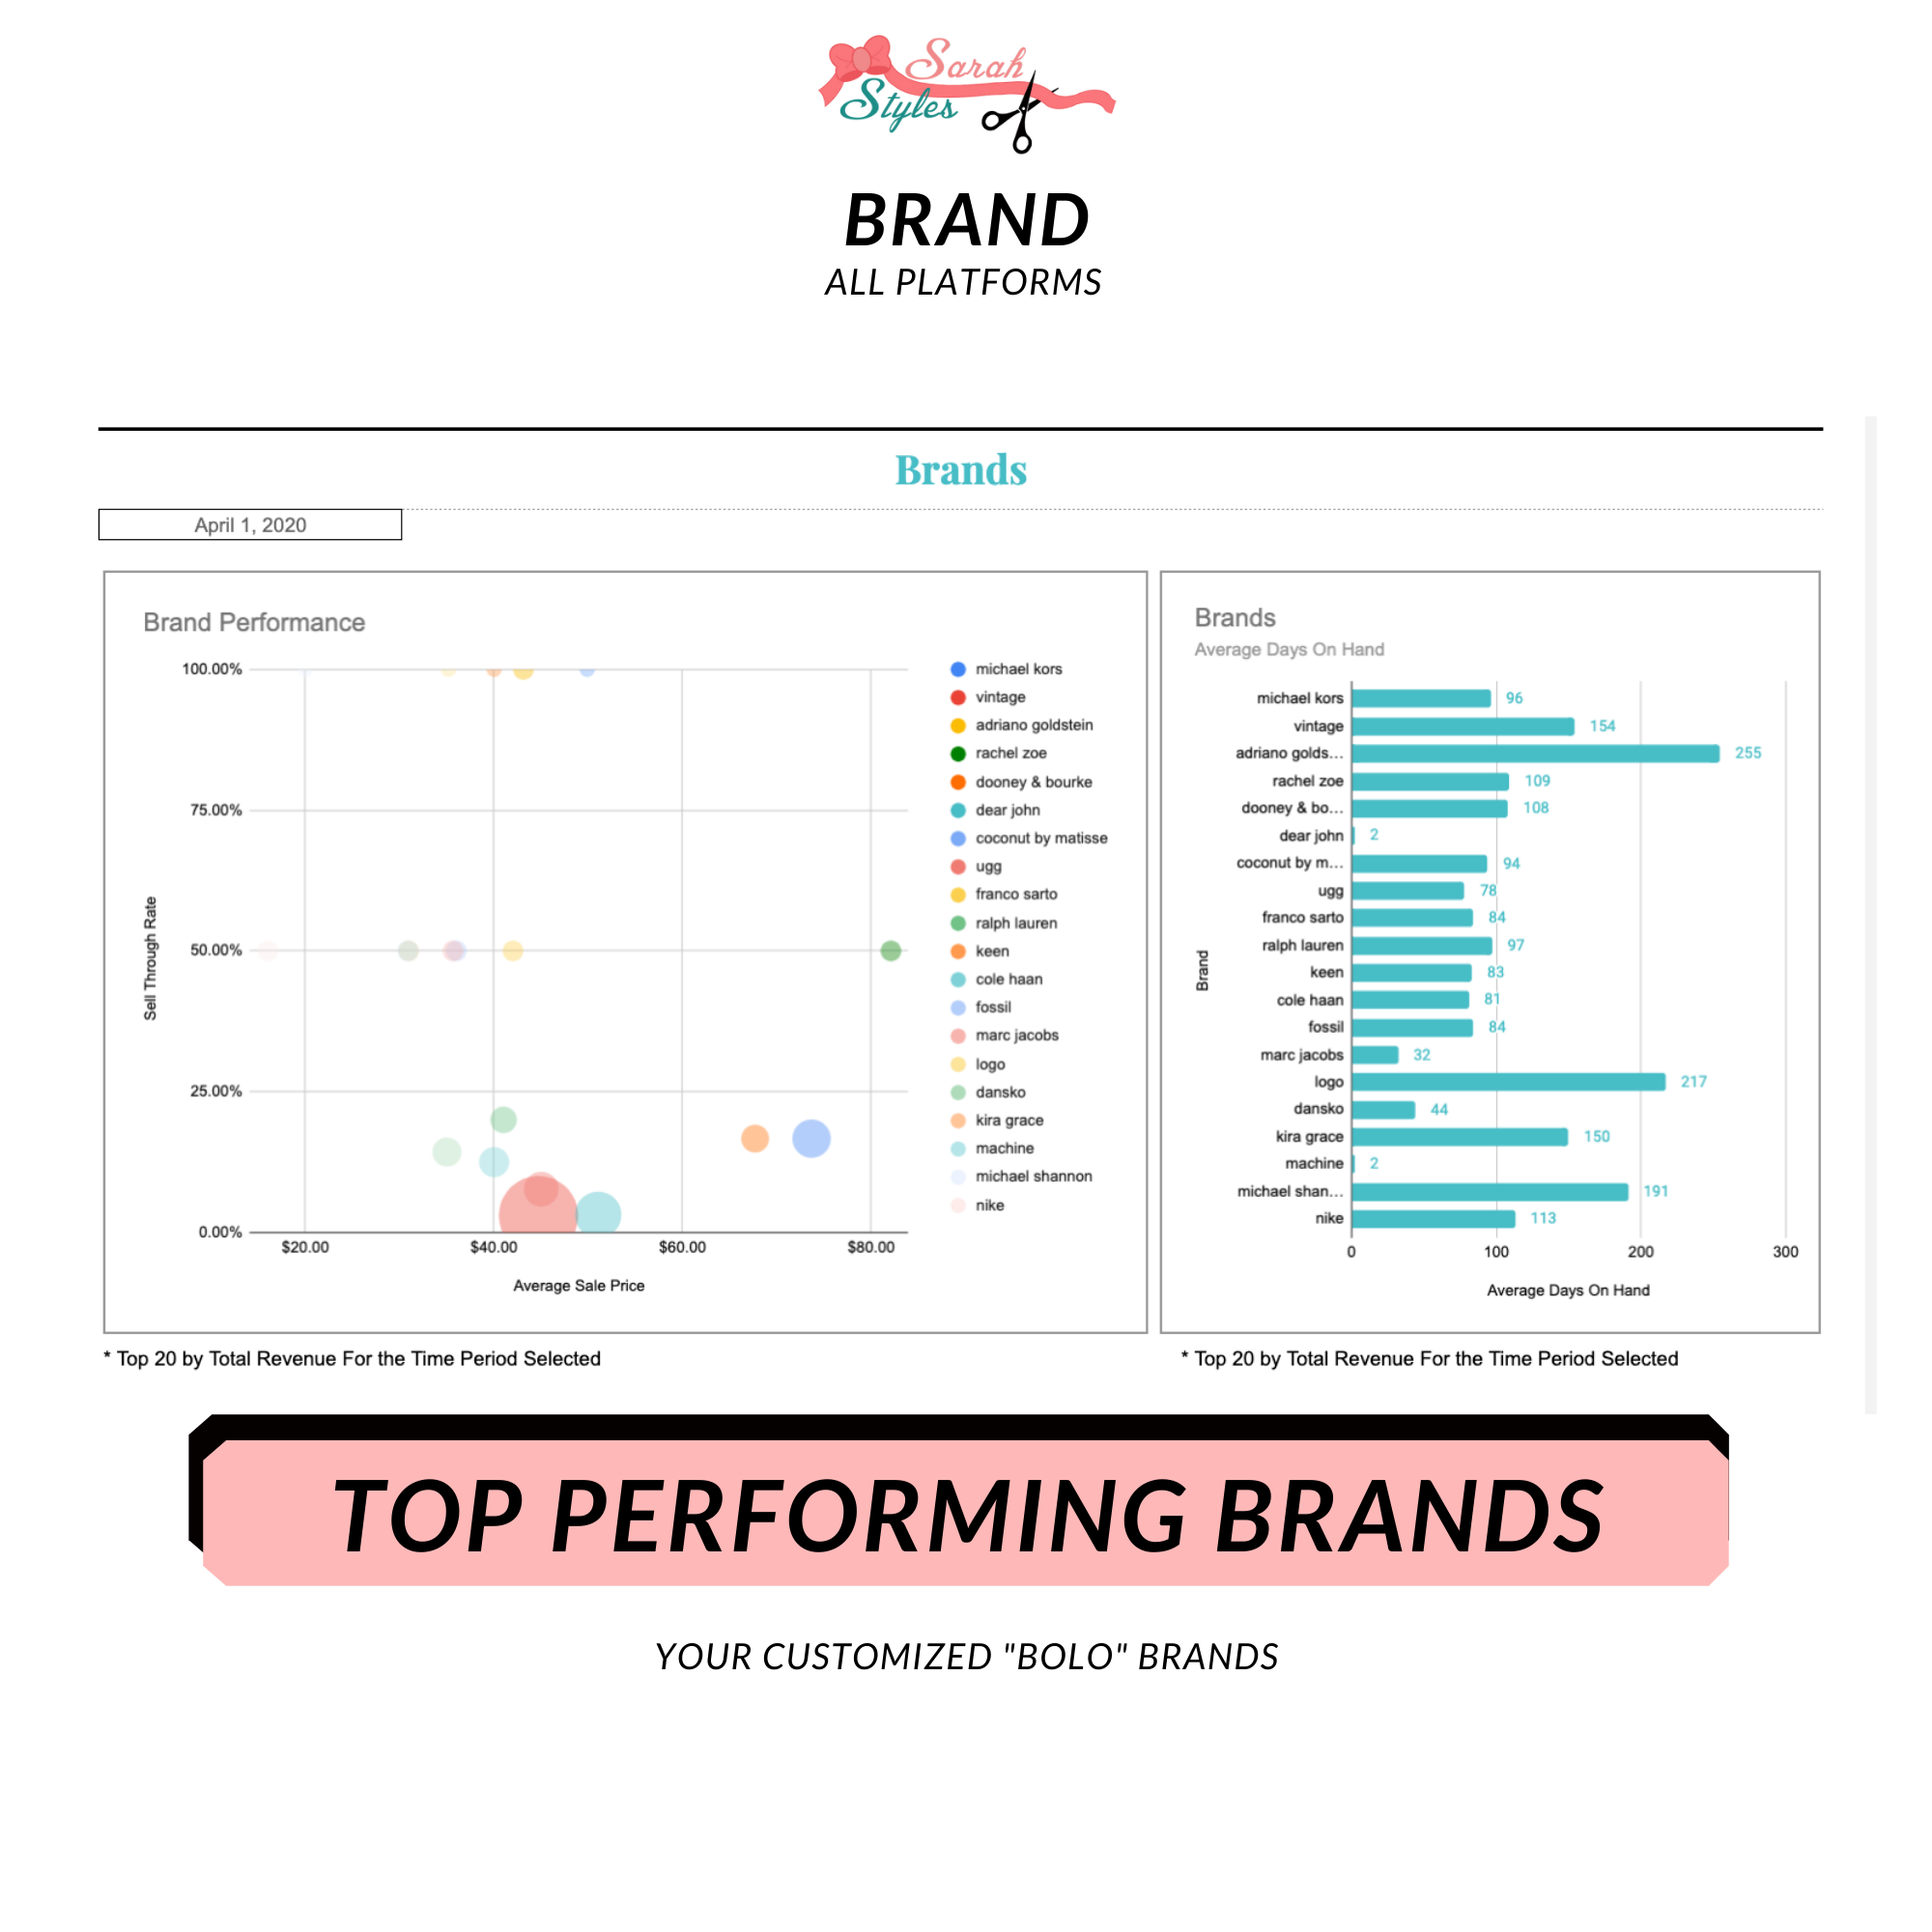
Brands – Top 20 Gross Revenue
– Sell Through Rate
– Average Sale Price
– Average Days on Hand
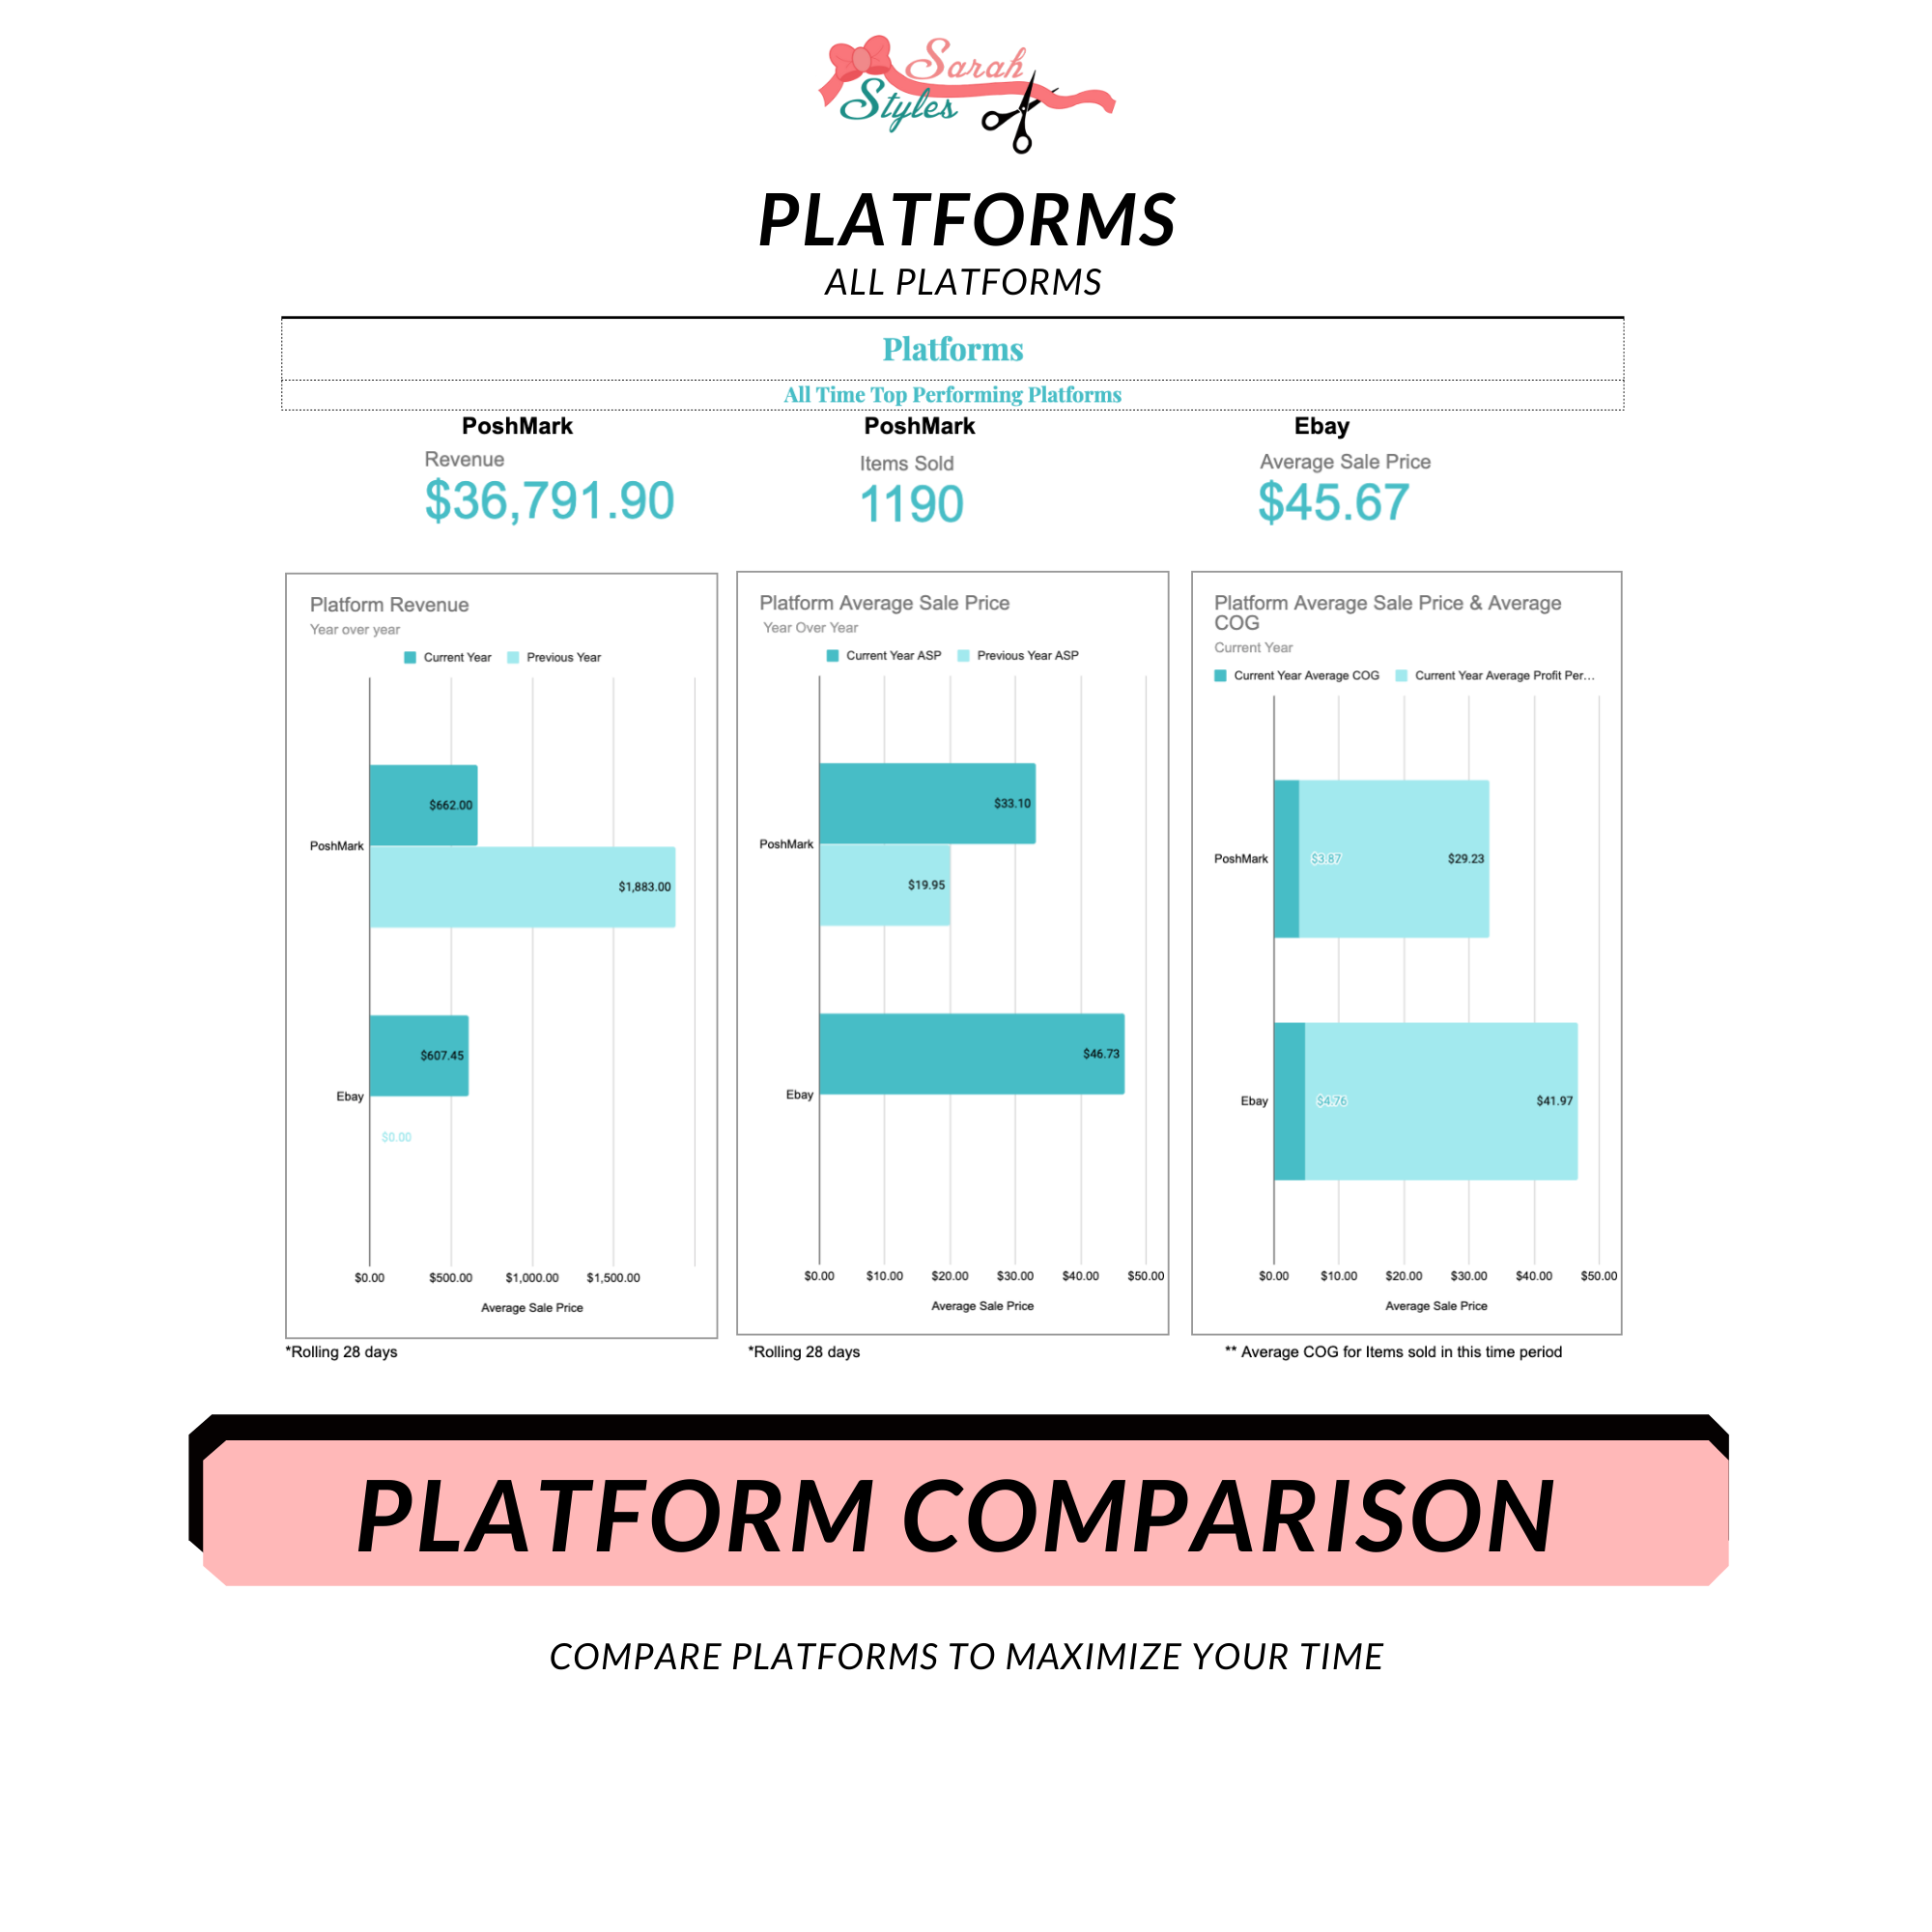
Platforms – All Platforms You Sell On
Platform Comparisons:
– Year over Year Revenue
– Year over Year Average Sale Price
– Average Sale Price & Average Cost of Good
All Time Top Performing Platform:
– Total Gross Revenue
– Total Items Sold
– Highest Average Sale Price
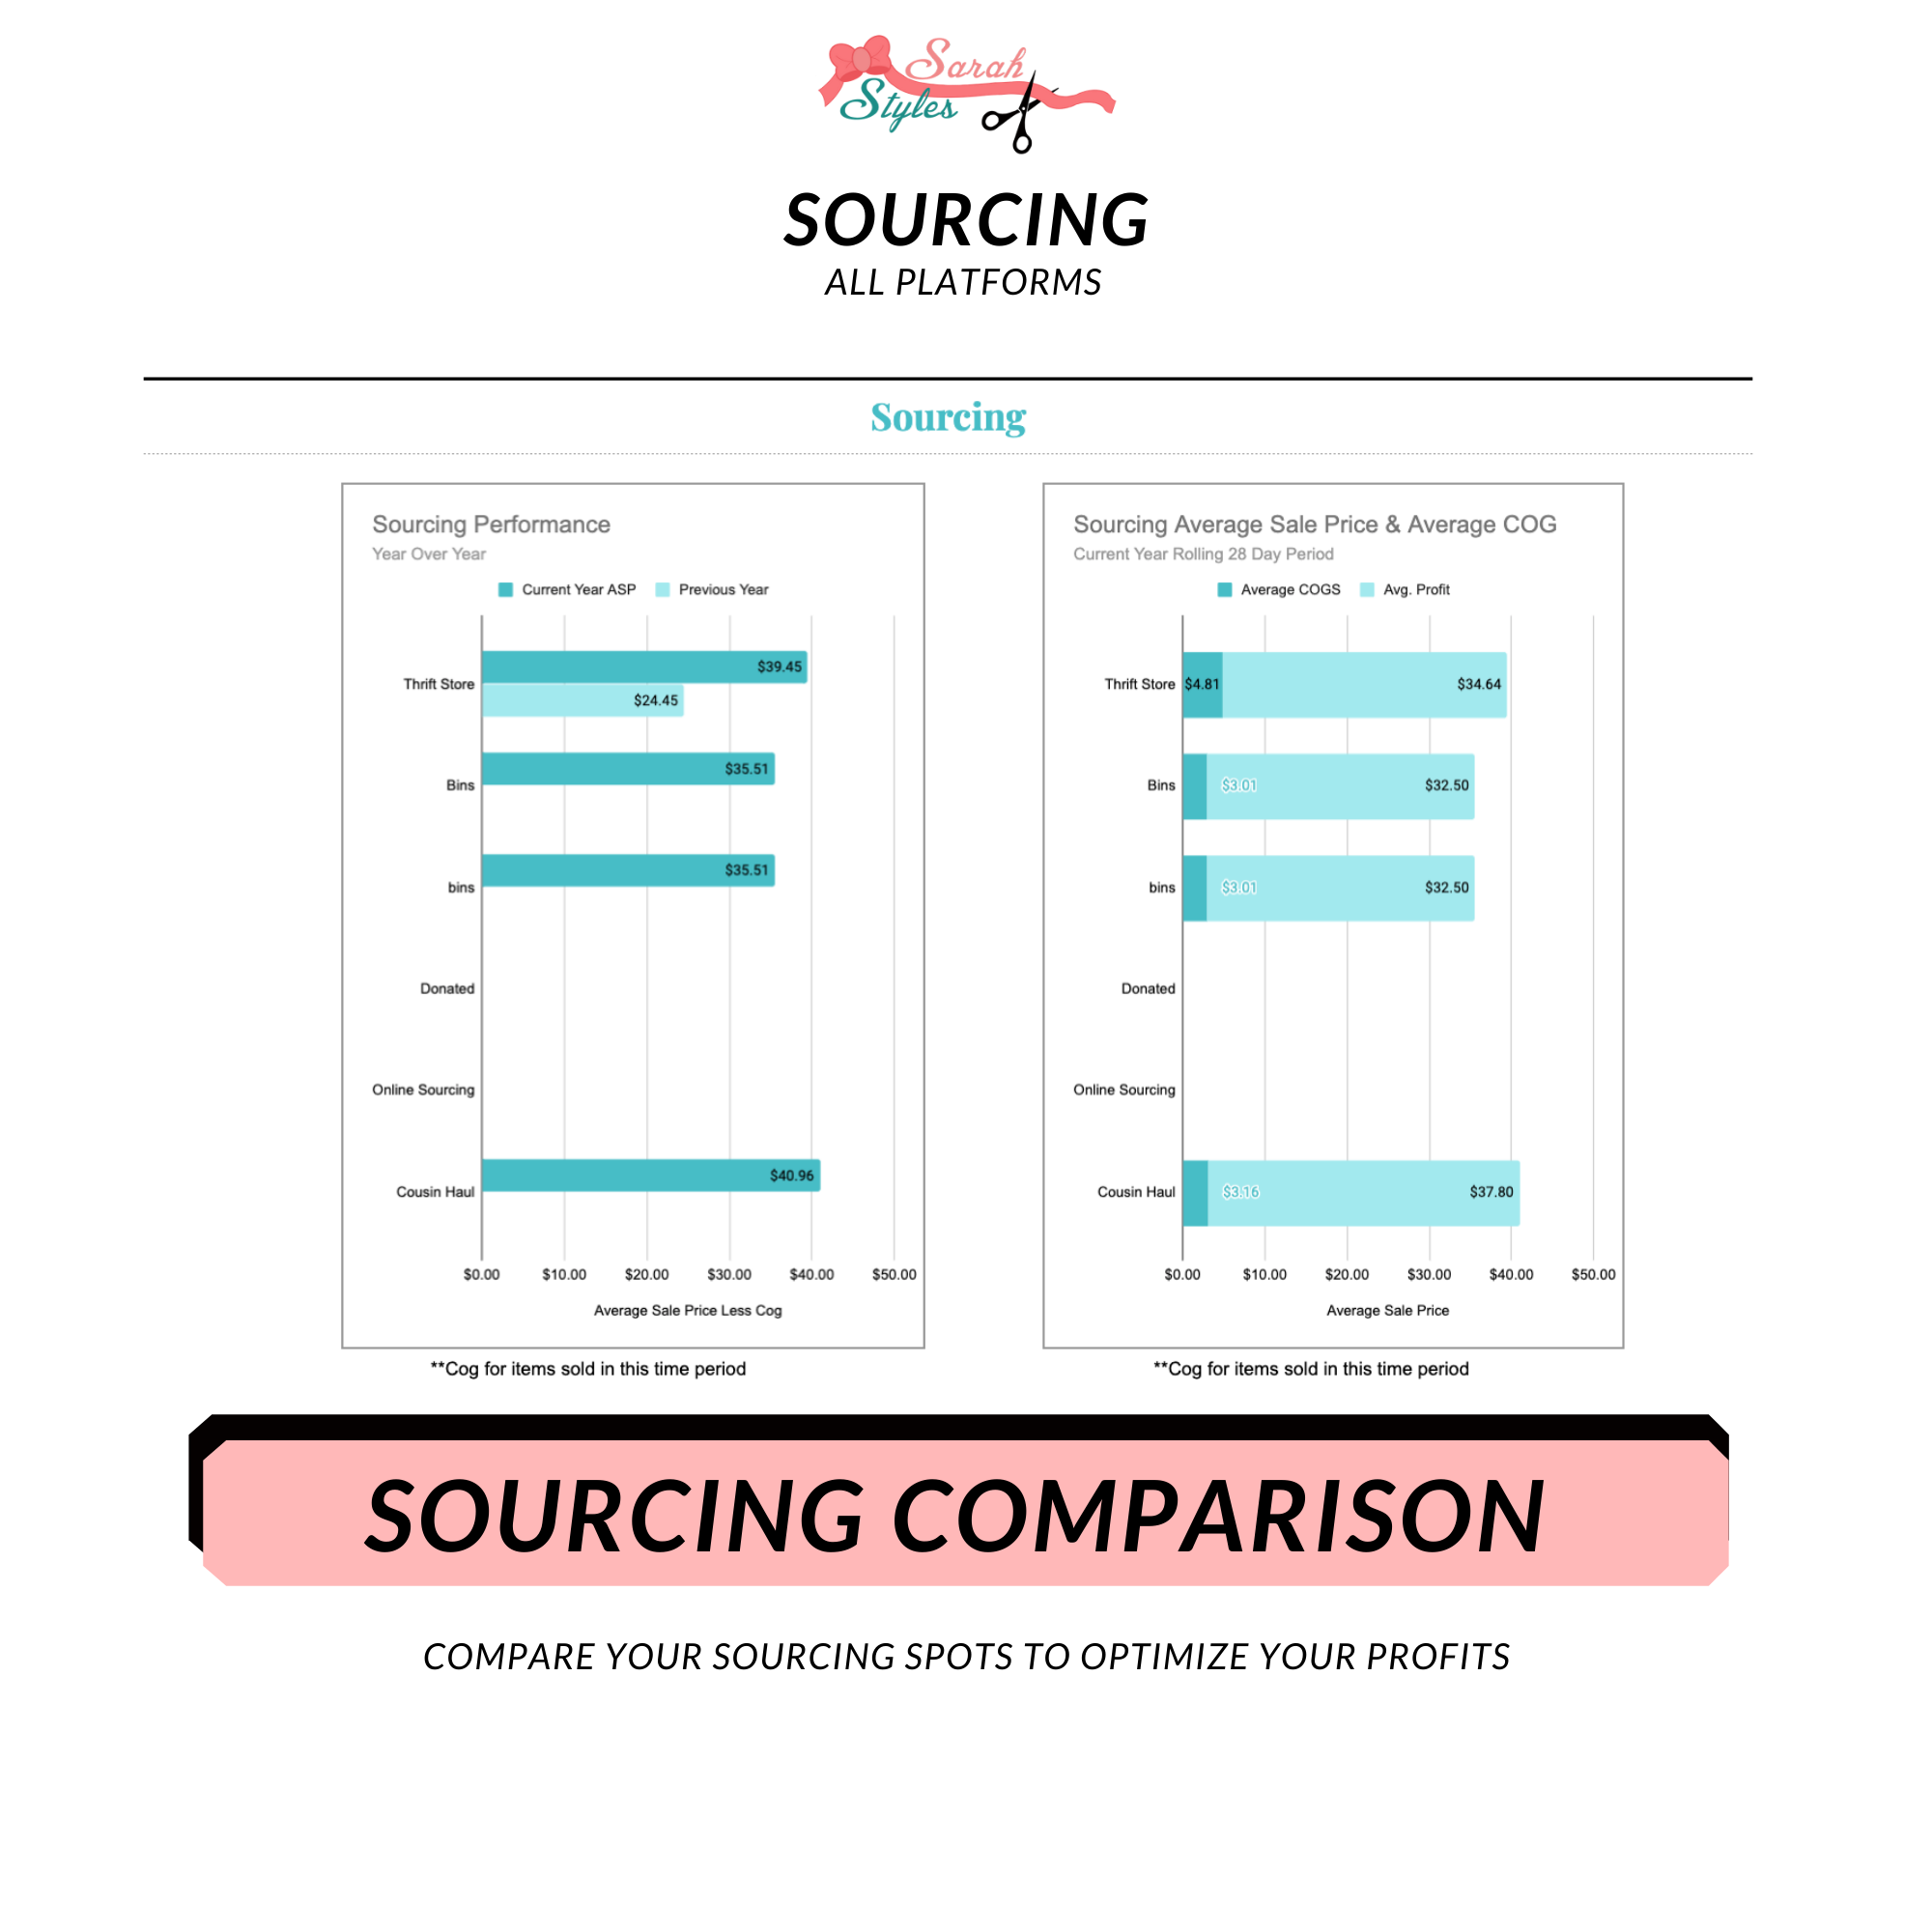
Sourcing – Data Broken Out by Sourcing Locations
– Year over Year Average Sale Price
– Average Sale Price & Average Cost of Good
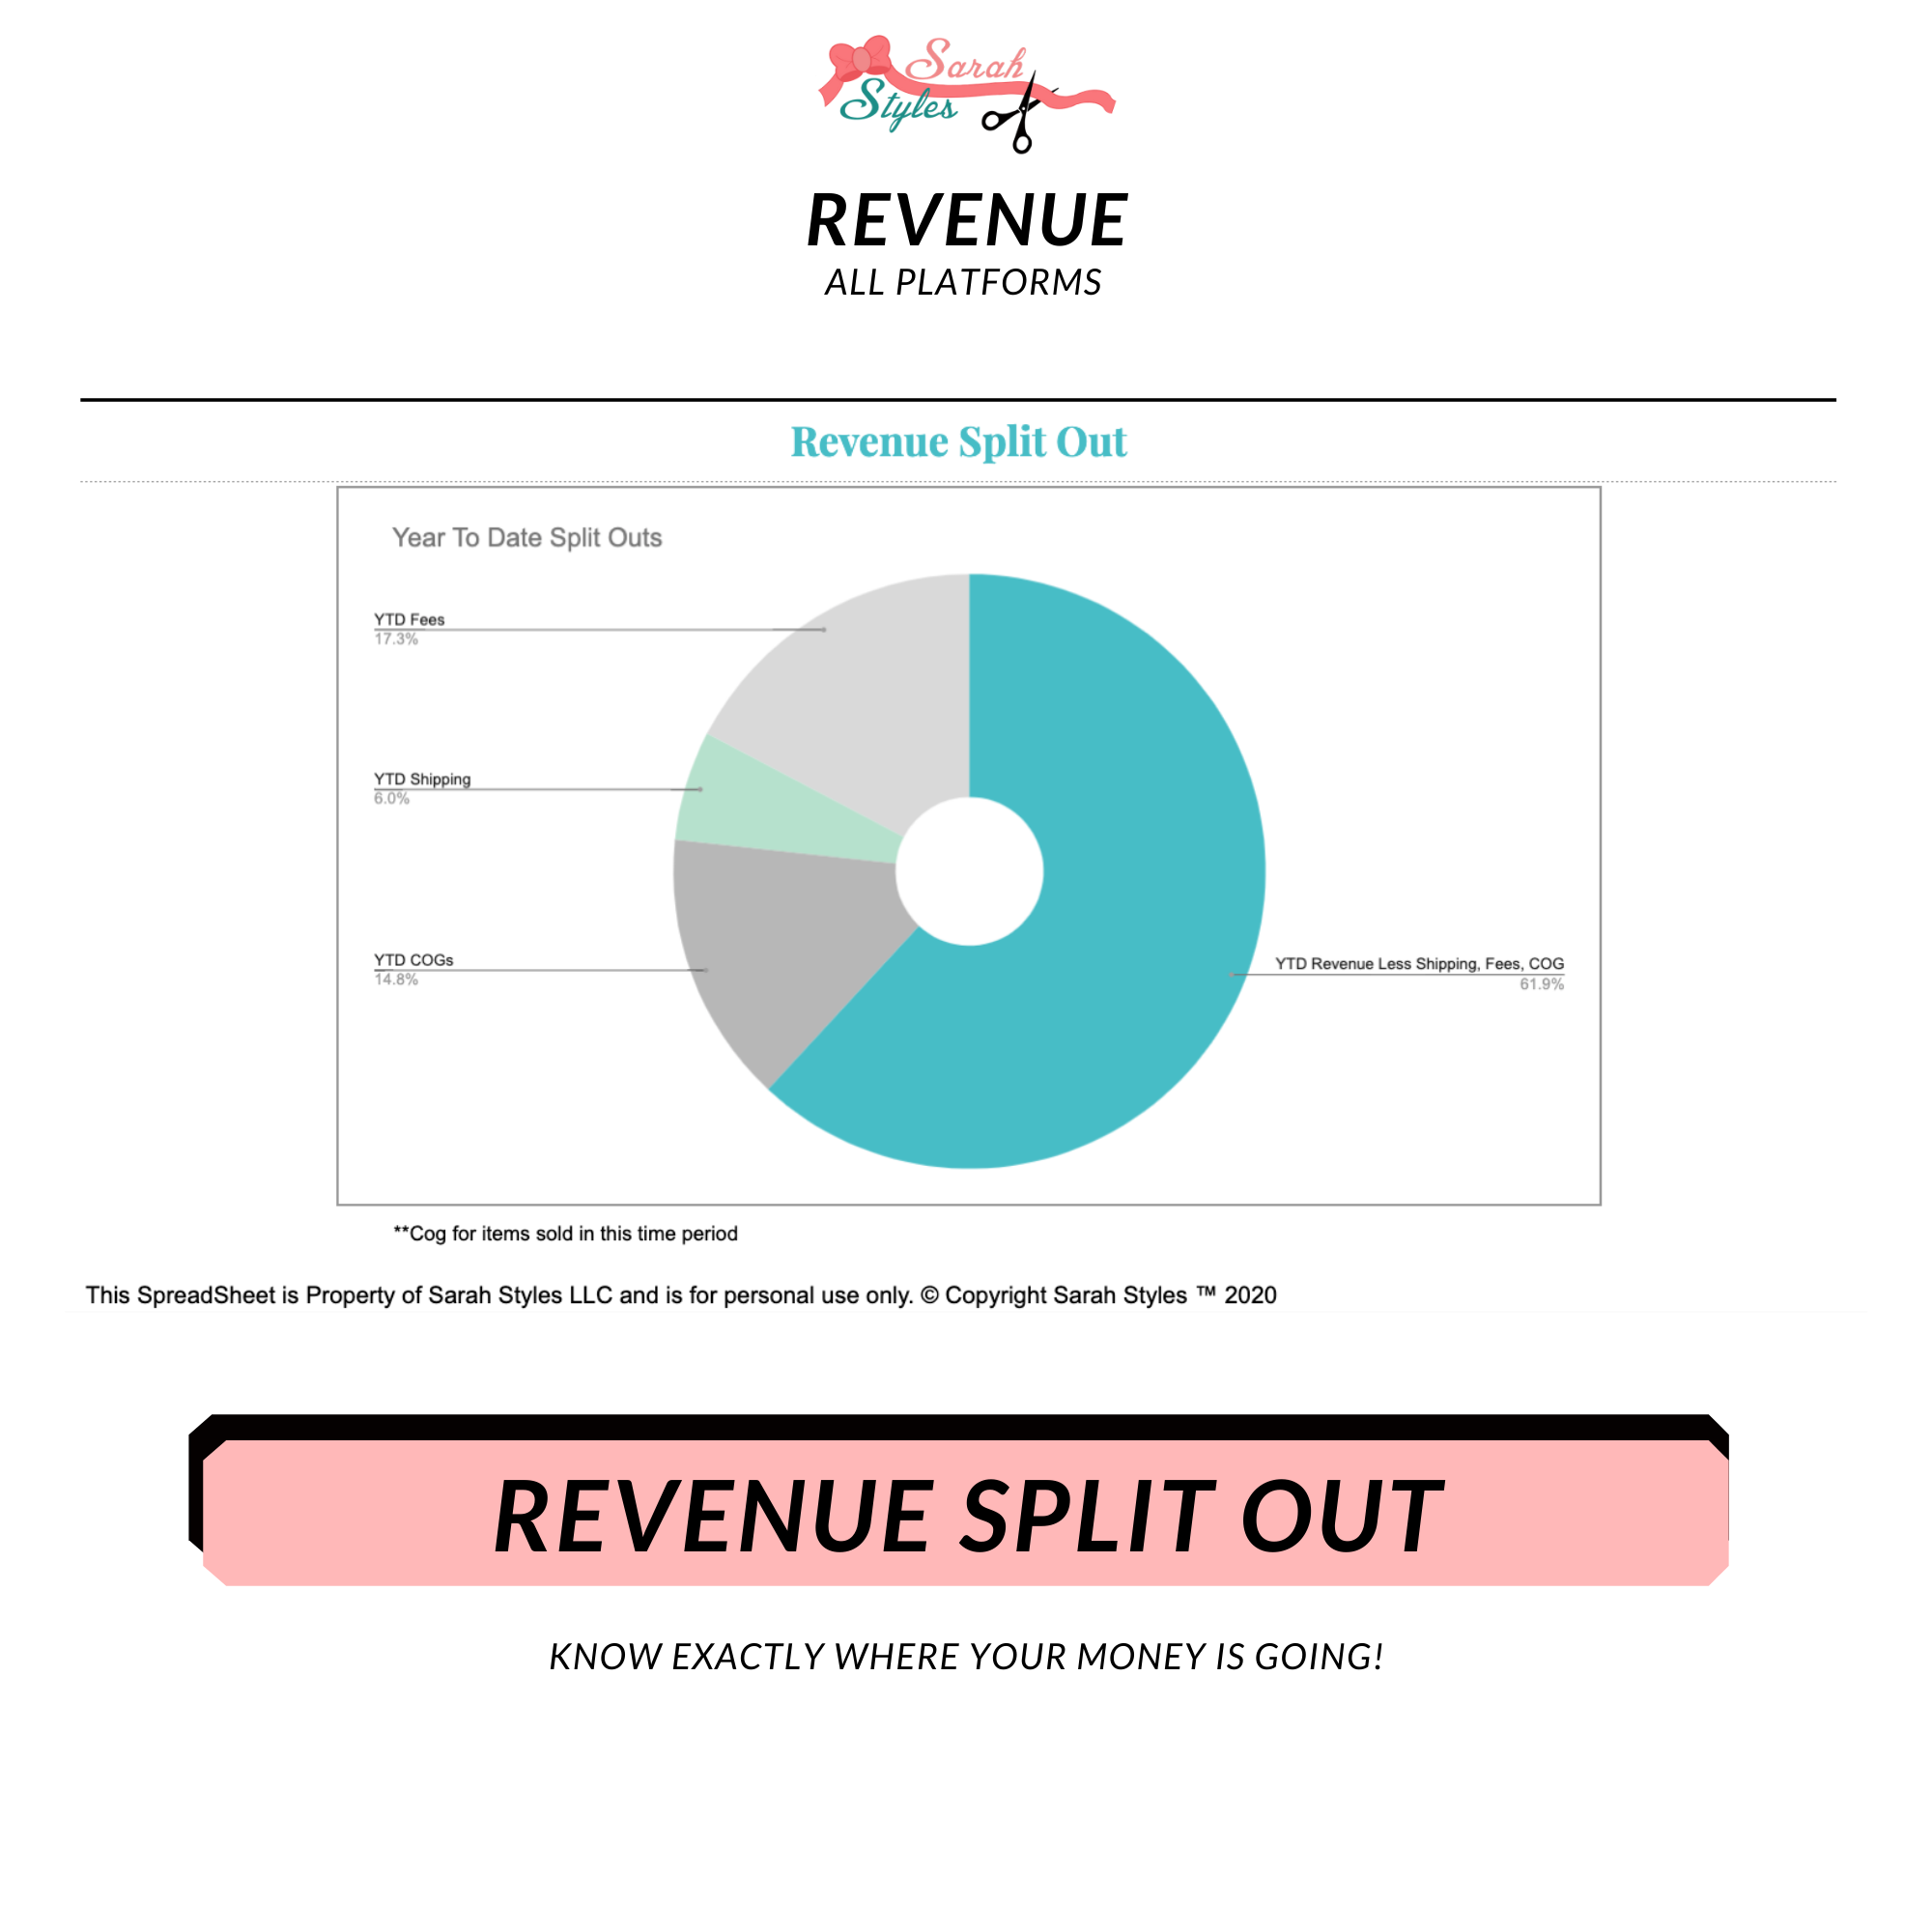
Revenue Split Out
Percentage Split
– Cost Of Goods
– Fees
– Shipping
– Gross Revenue
EVEN MORE!!! With purchase of this spreadsheet you will gain access to my exclusive facebook group for Data Analysis spreadsheet users. Additionally, a YouTube channel and Instagram dedicated to data analytics for the reseller where I use this tool (and others). I have a degree in mathematics with 17 years of reselling/upcycling experience and 7 years of statistical analysis, modeling, and forecasting experience. Big things can happen when we support each other! Join a community that is using this tool to build their business. The Facebook group does live sessions with me, troubleshooting, goal setting, and overall peer to peer support!
You must have and know how to use a Google account to access the dashboard. I am not responsible for Google Sheets or the Google platform. I support the Dashboard only. The Dashboard is editable on a computer and viewable on tablets and phone If stay logged in on the computer.
When you purchase this product you will receive a word document with a link for a Google form to fill out to gain access the Dashboard, along with links for the facebook group. If you don’t have Microsoft Office you can open the form in Google Docs. Once you fill out the survey you will receive an email with download instructions and a tutorial video. ******WATCH THE ENTIRE VIDEO BEFORE DOWNLOADING. ***IF INSTRUCTIONS ARE NOT FOLLOWED THE DASHBOARD WILL NOT WORK AND WILL NOT BE SUPPORTED. YOU WILL HAVE TO PURCHASE A NEW ONE****
ALL COMMUNICATIONS WILL GO TO YOUR GOOGLE EMAIL. Make sure to check it and your junk folder regularly. Feel free to reach out here if you have any questions.
This spreadsheet can only be opened in Google sheets. If the spreadsheet is opened in other programs, it will break and Sarah Styles™ will not be held liable for any resulting errors or be responsible for repairing the spreadsheet. The dashboard has a log in to YOUR gmail account, and can only be used on one gmail account. The Dashboard uses a macro and Google terms and services apply. NO REFUNDS, as this is an instant downloadable product. Please ask questions before you purchase.
If you update or change information or formulas beyond the allotted cells the spreadsheet will break, and Sarah Styles™ will no longer support it. Sarah Styles™ makes no representation about your future sales or success. This spreadsheet is copyrighted by Sarah Styles™ LLC, and it may not be redistributed, shared, copied, or have derivative works created therefrom. Sarah Styles™ LLC reserves all rights and remedies available by law. This product is subject to updates and fees may apply.
Poshmark ® is a registered trademark of Poshmark Inc., and references to Poshmark herein are not to be construed as endorsement by or affiliation with Poshmark, Inc.
Google ®, Gmail, ® Microsoft Excel ®, Ebay®, Mercari®, YouTube ®, and Facebook ® are each the registered trademarks of their respective owners.




Reviews
There are no reviews yet.